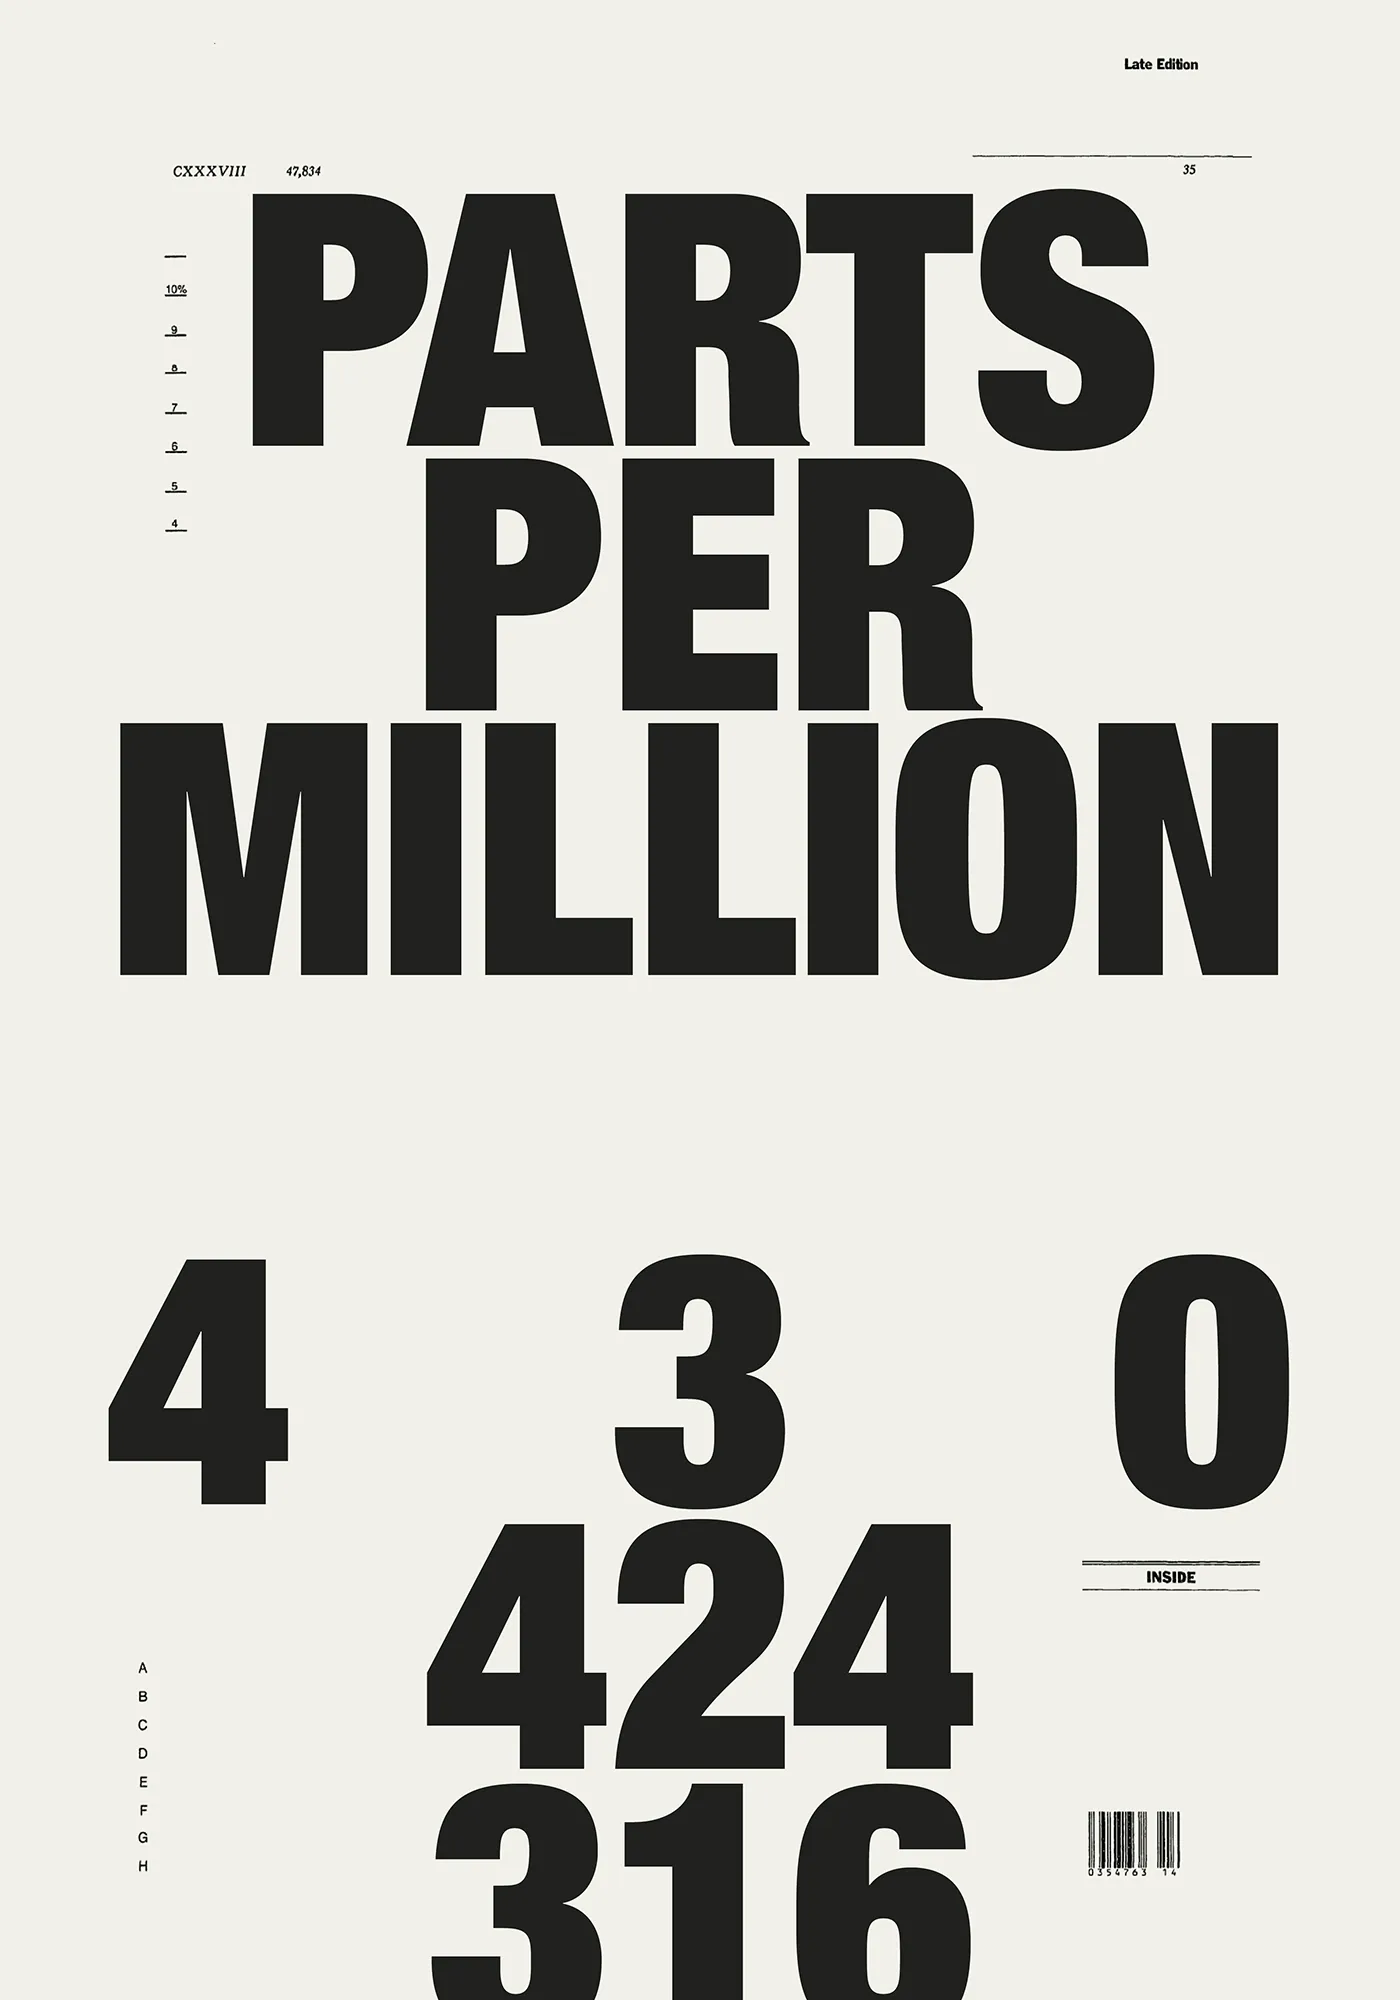
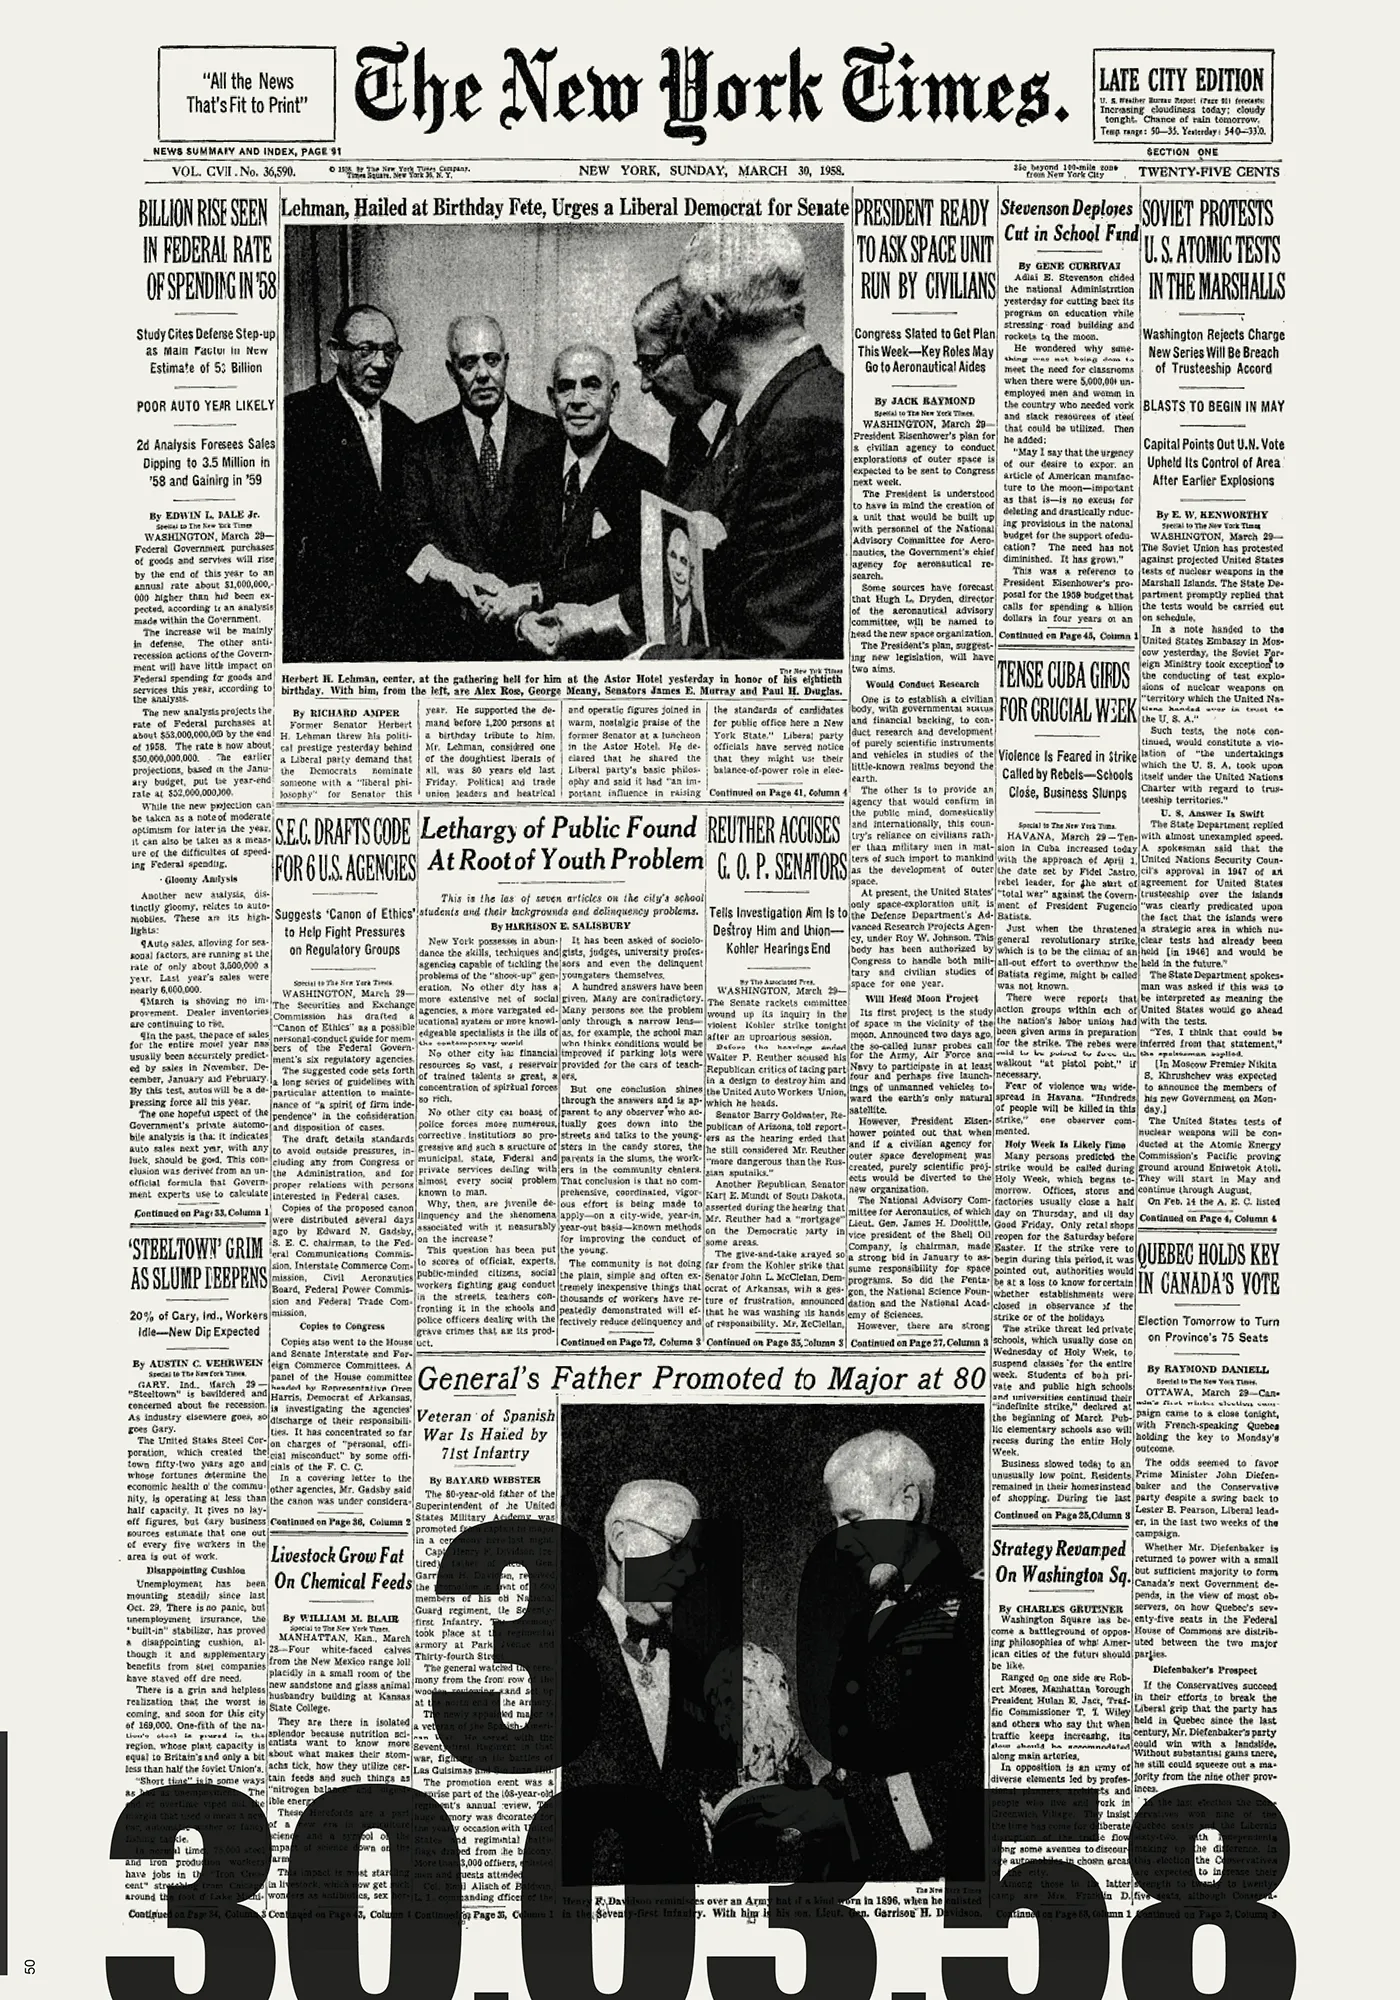
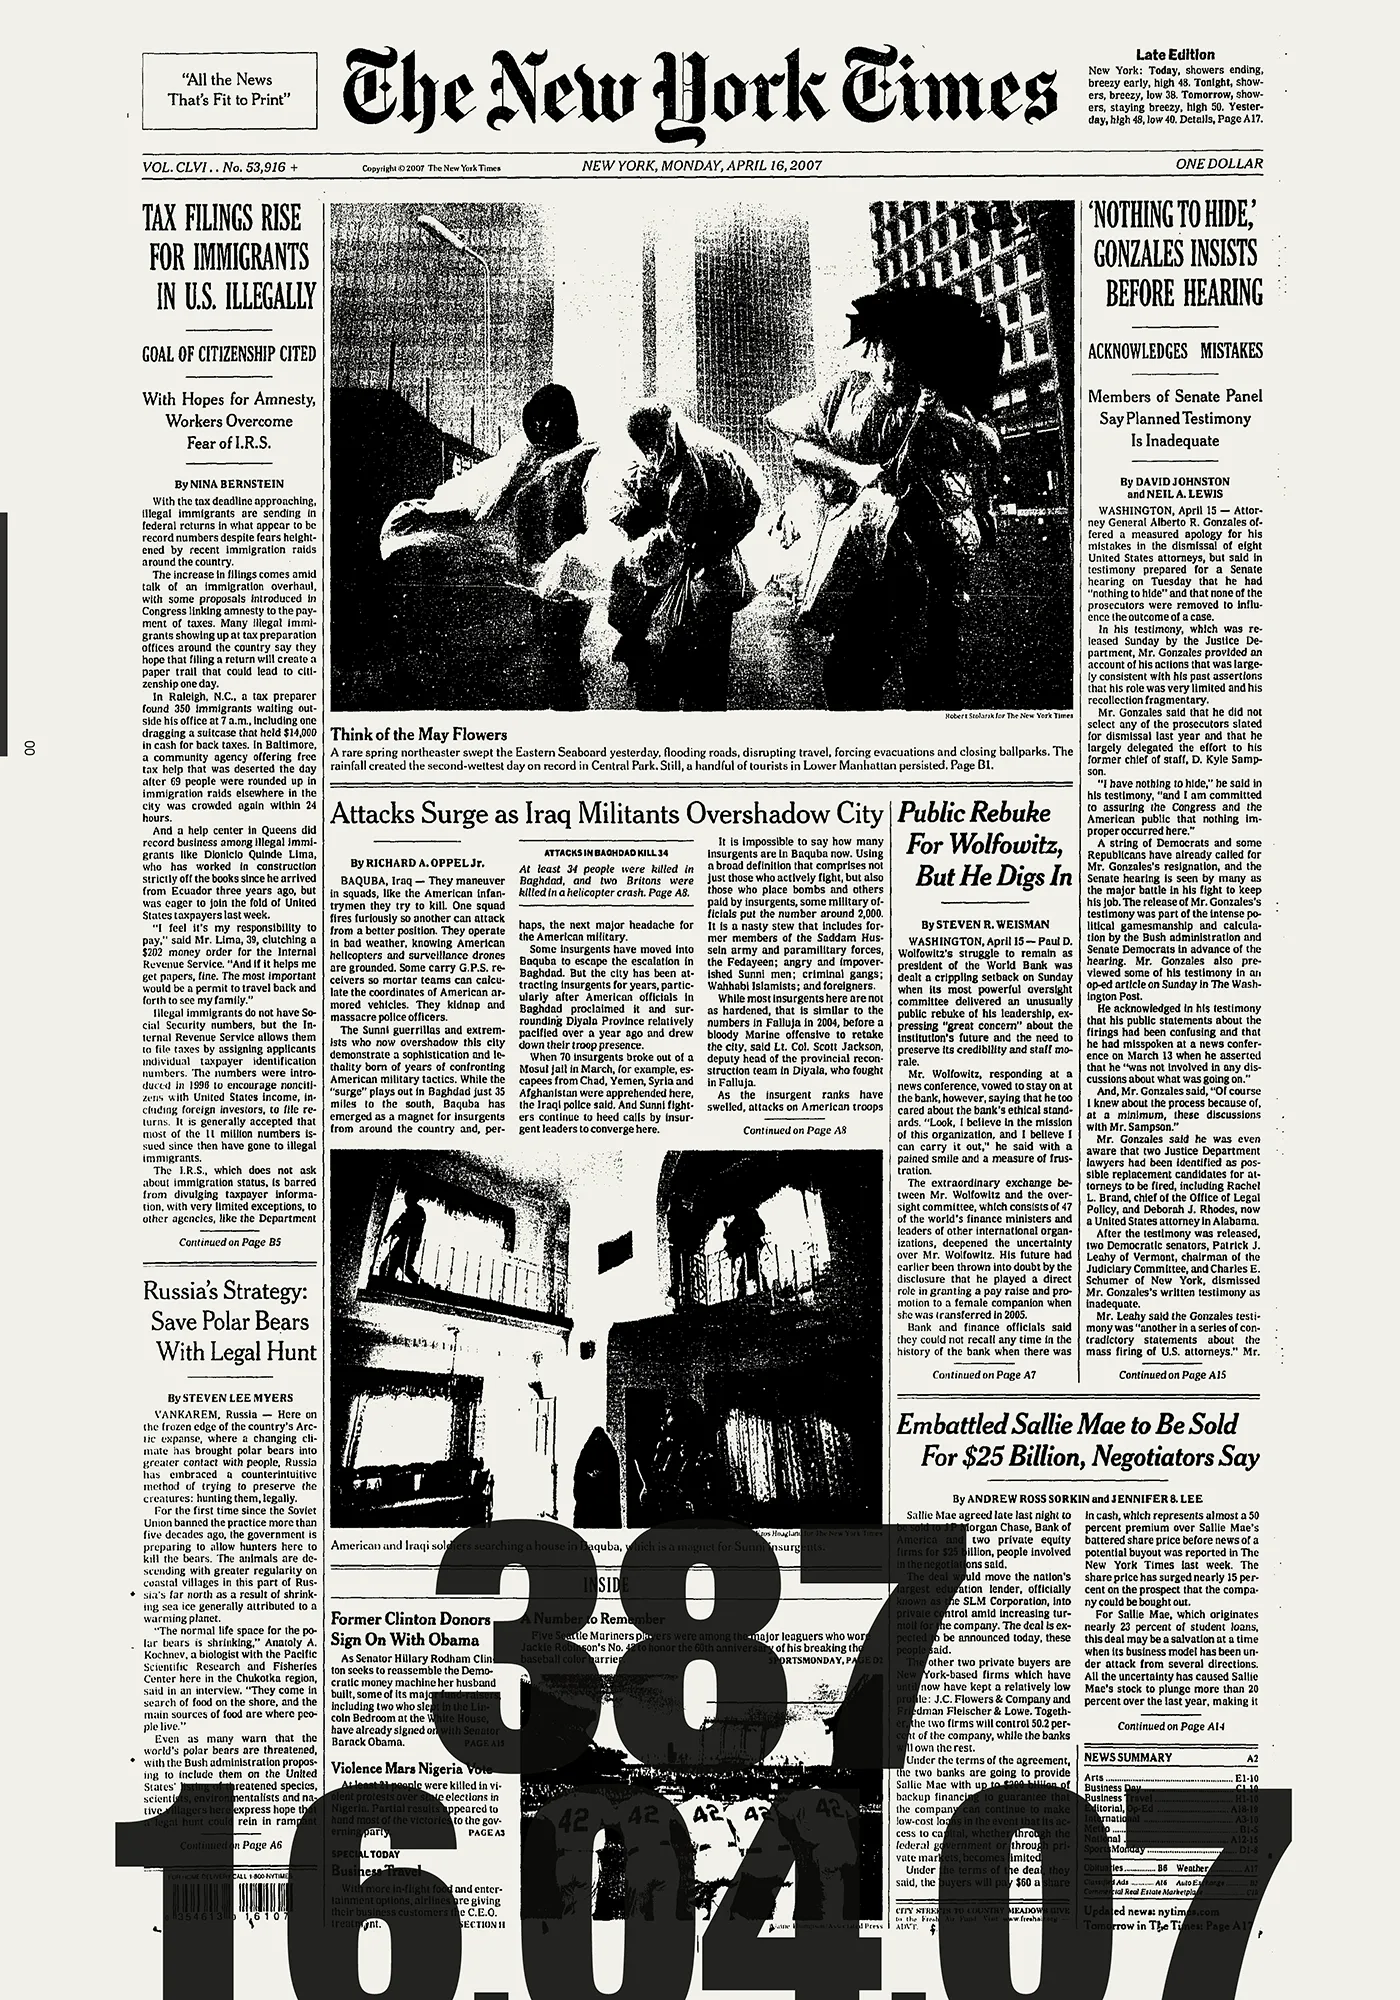
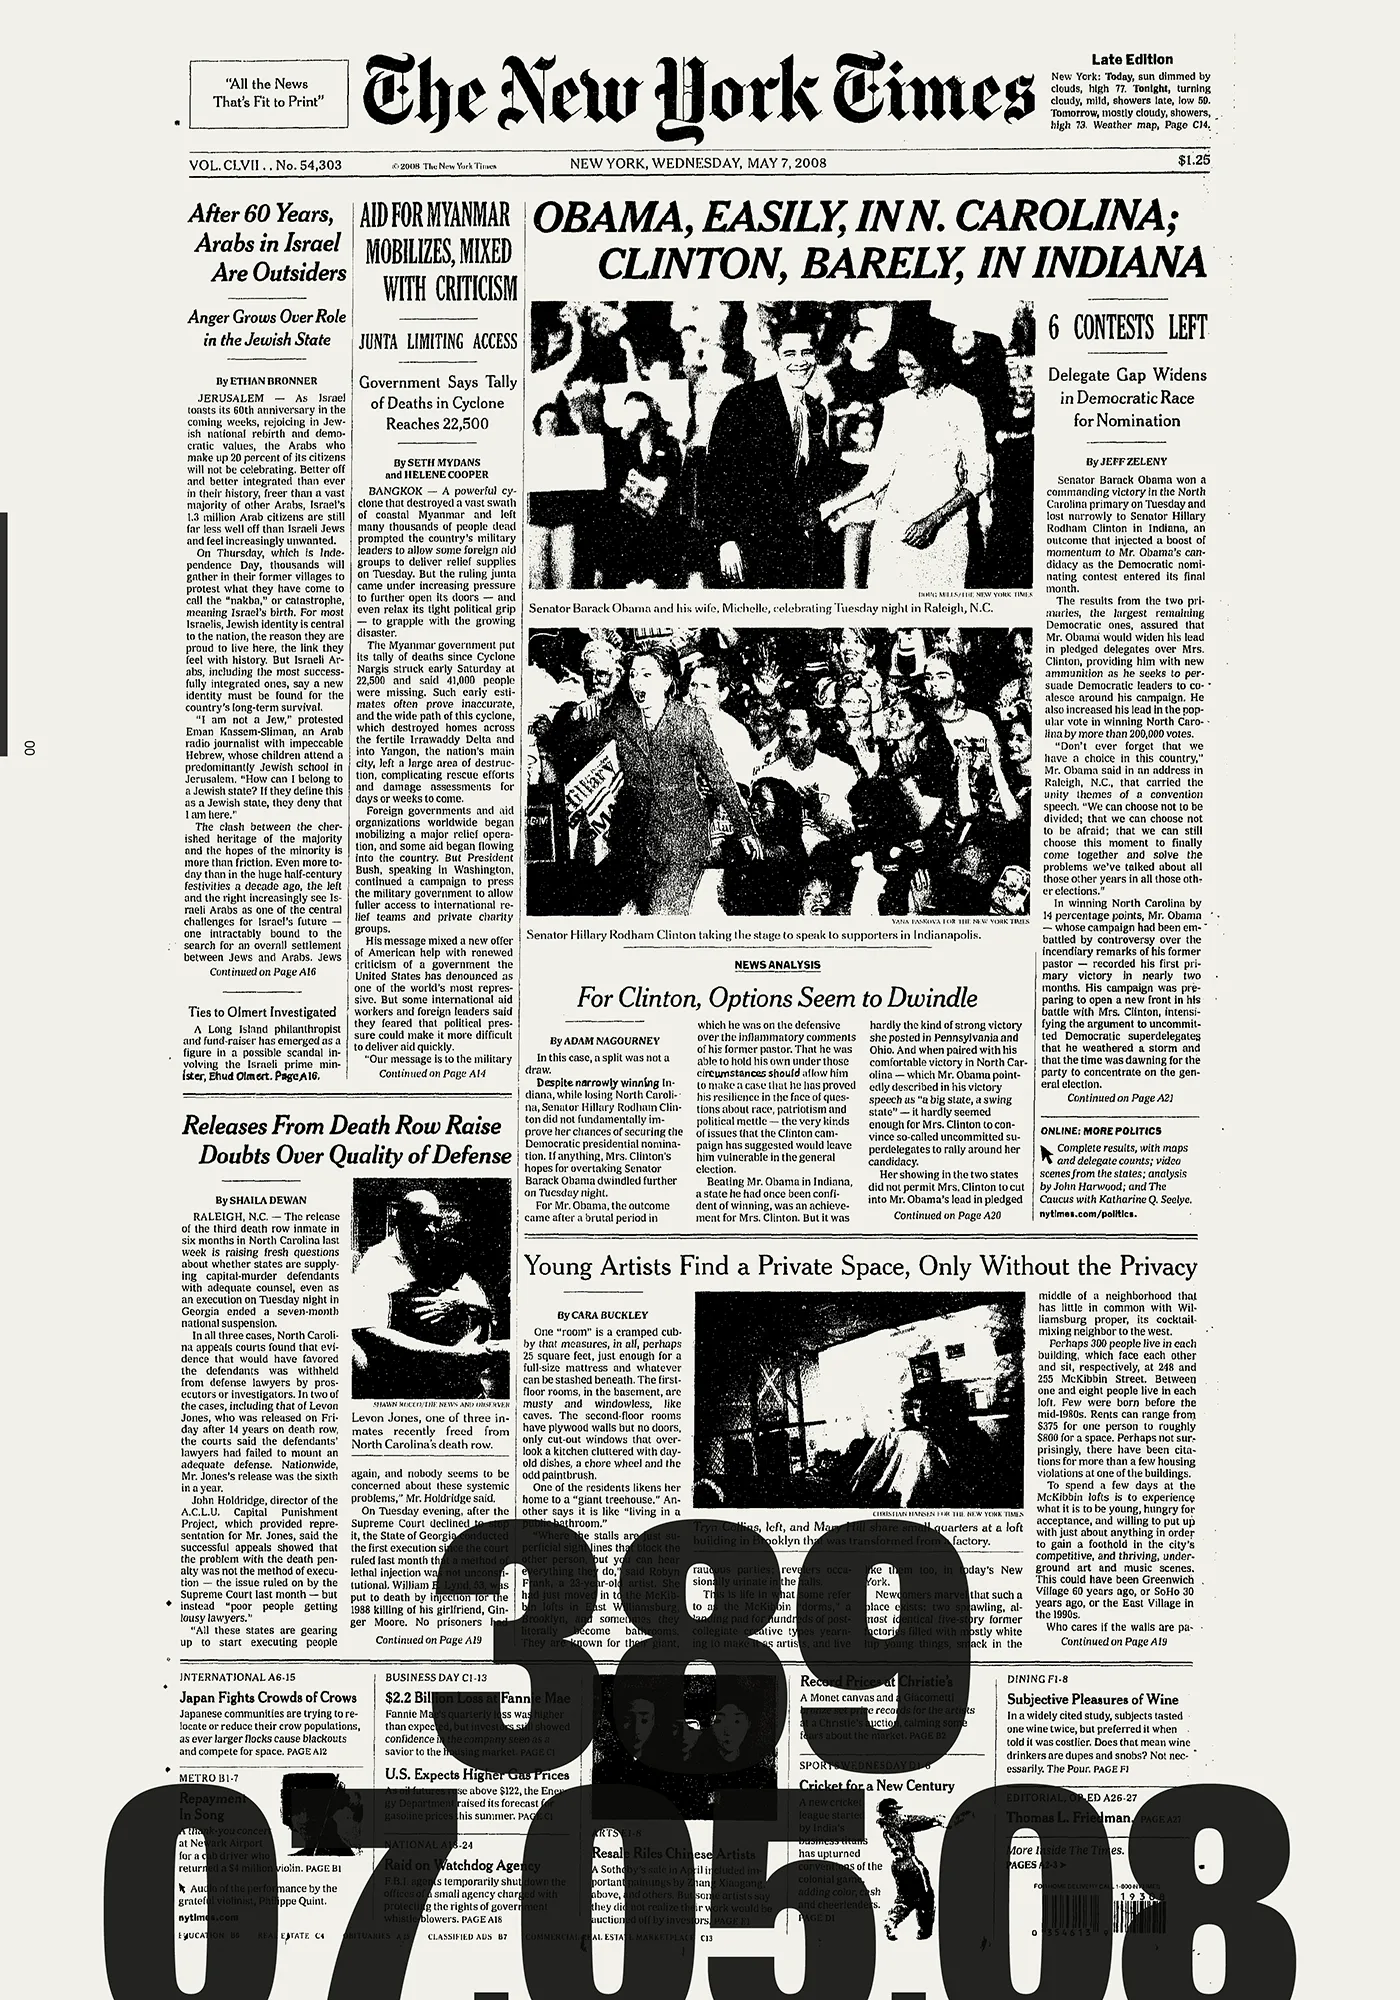
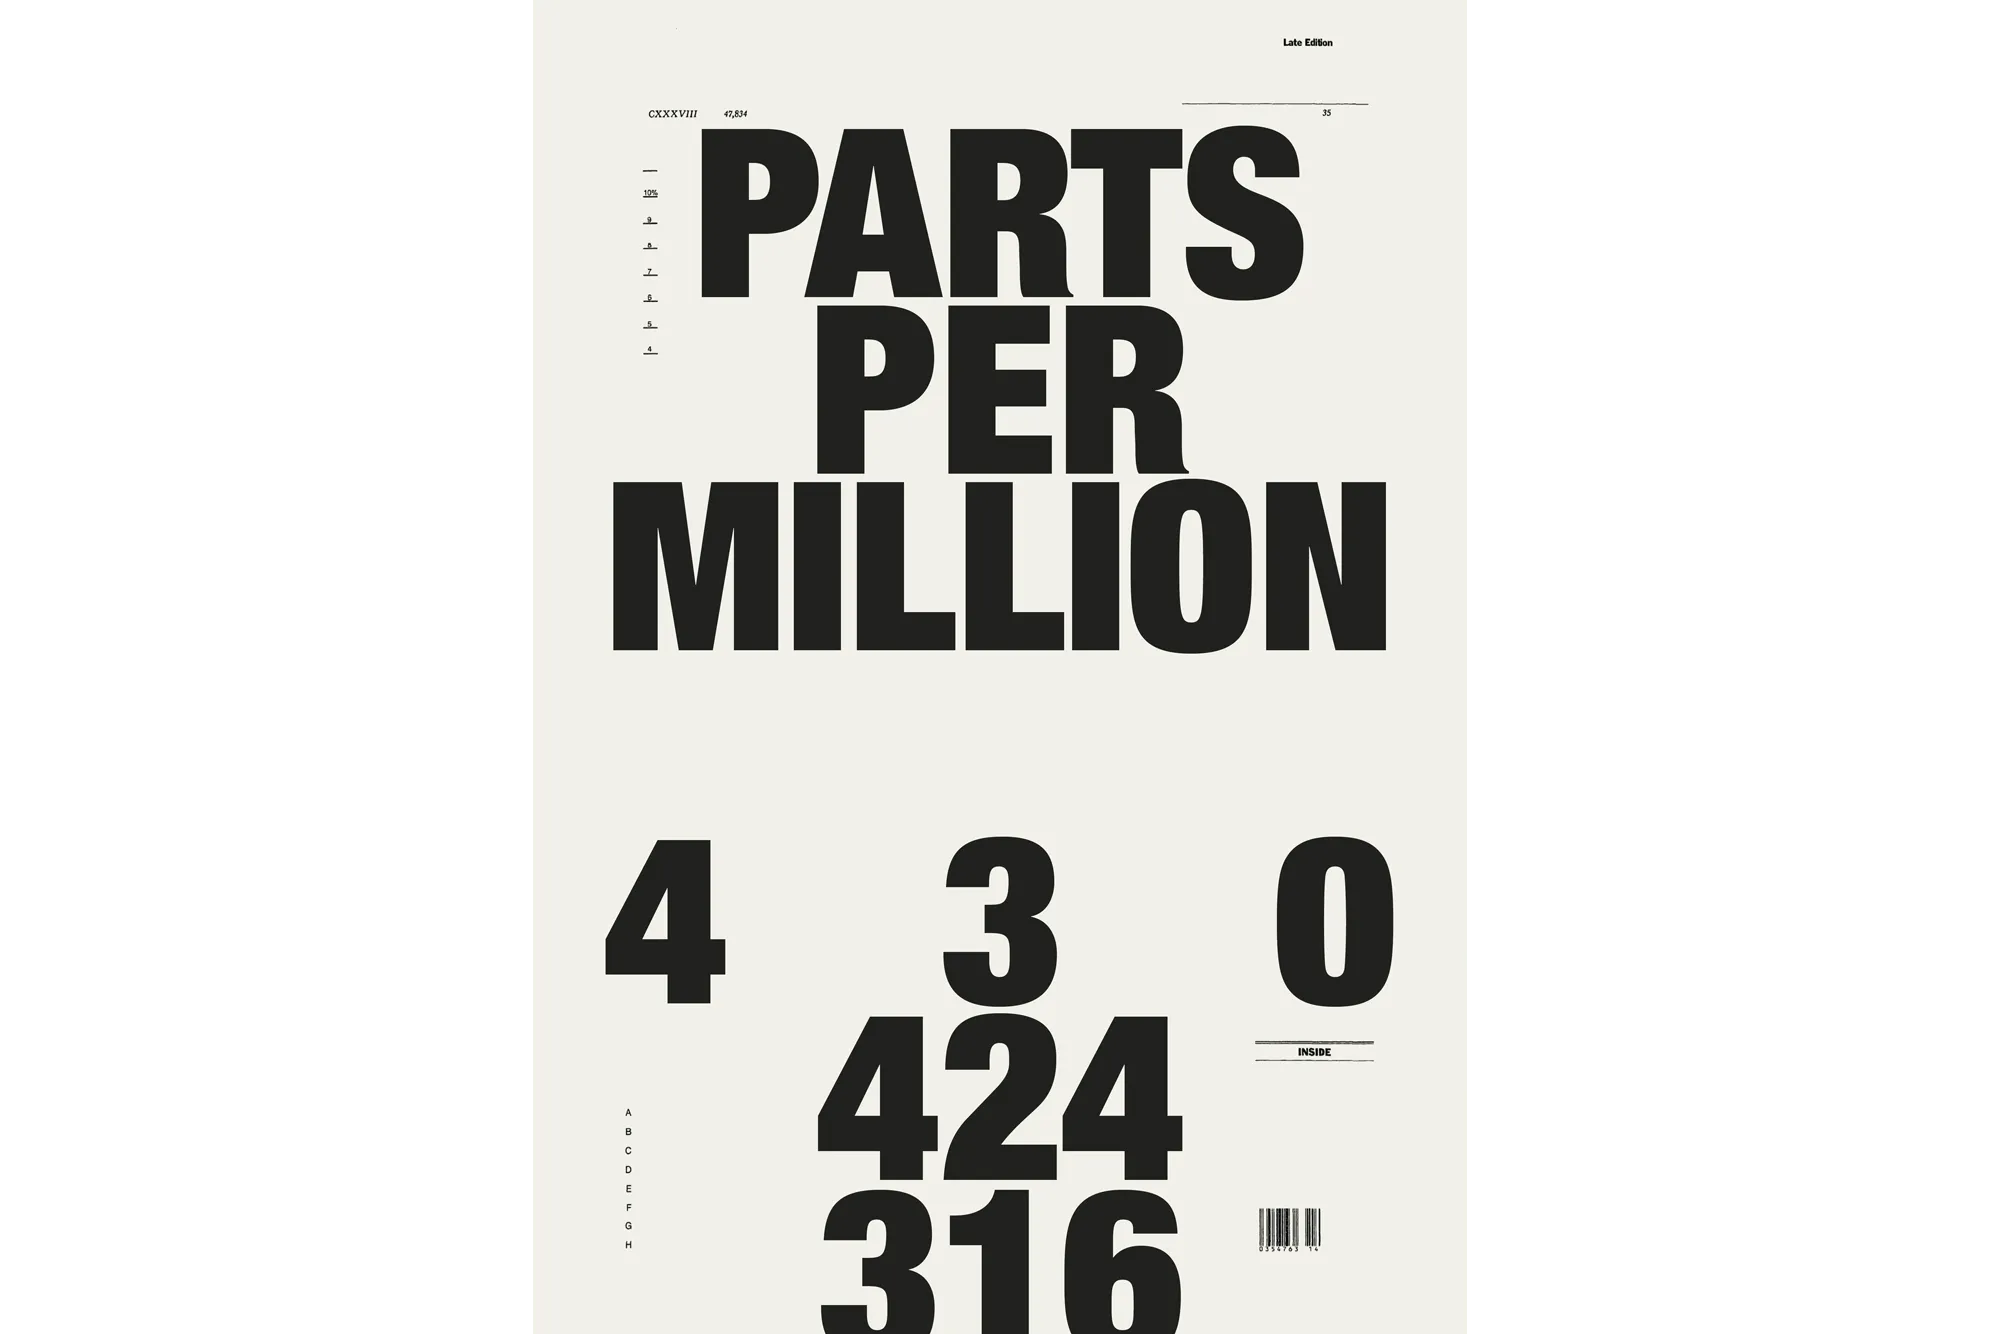
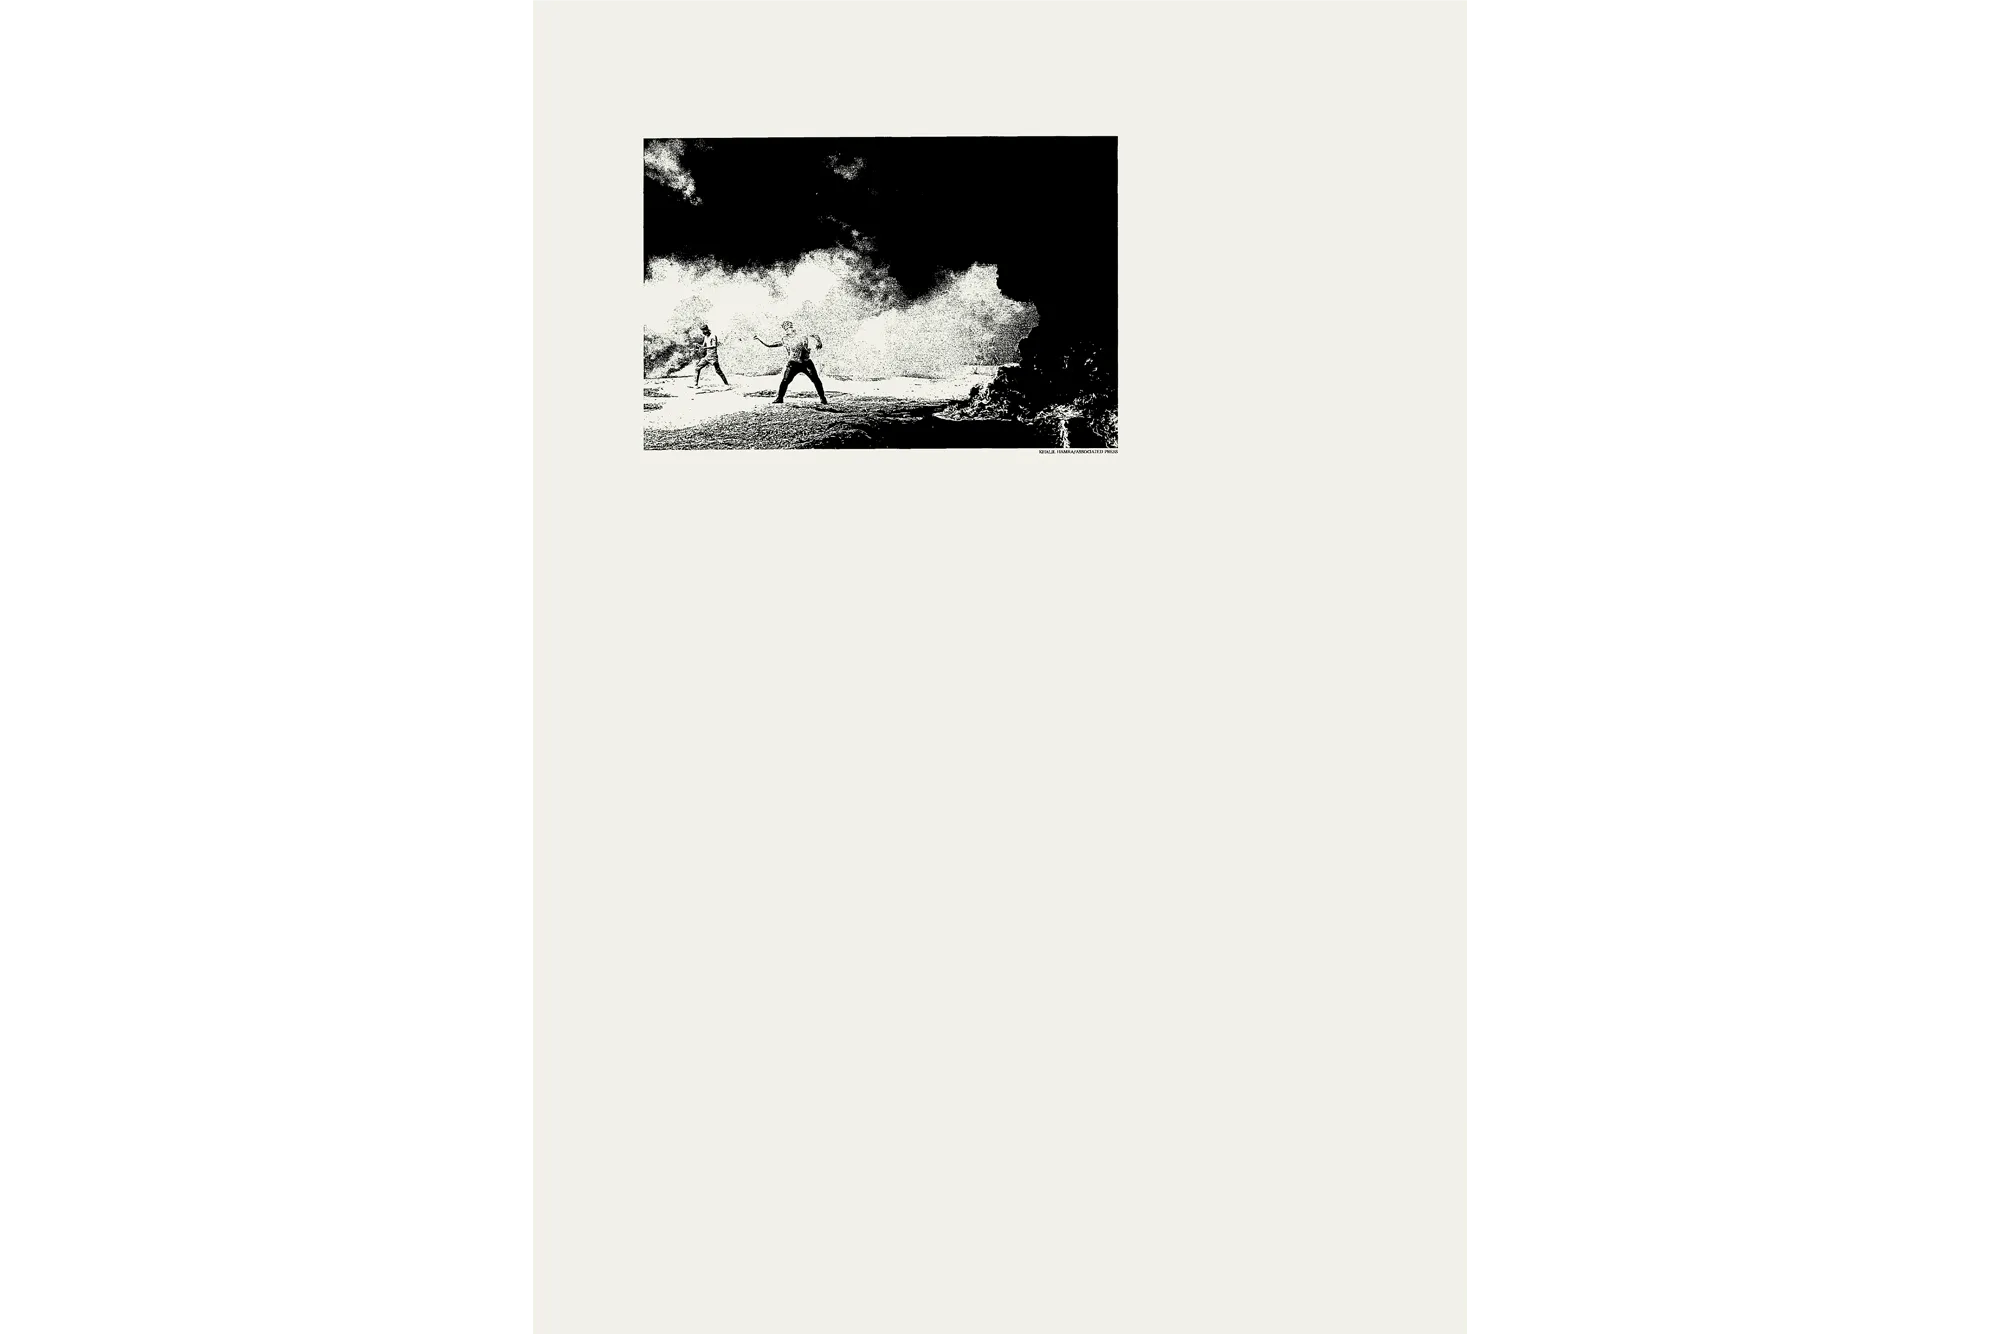
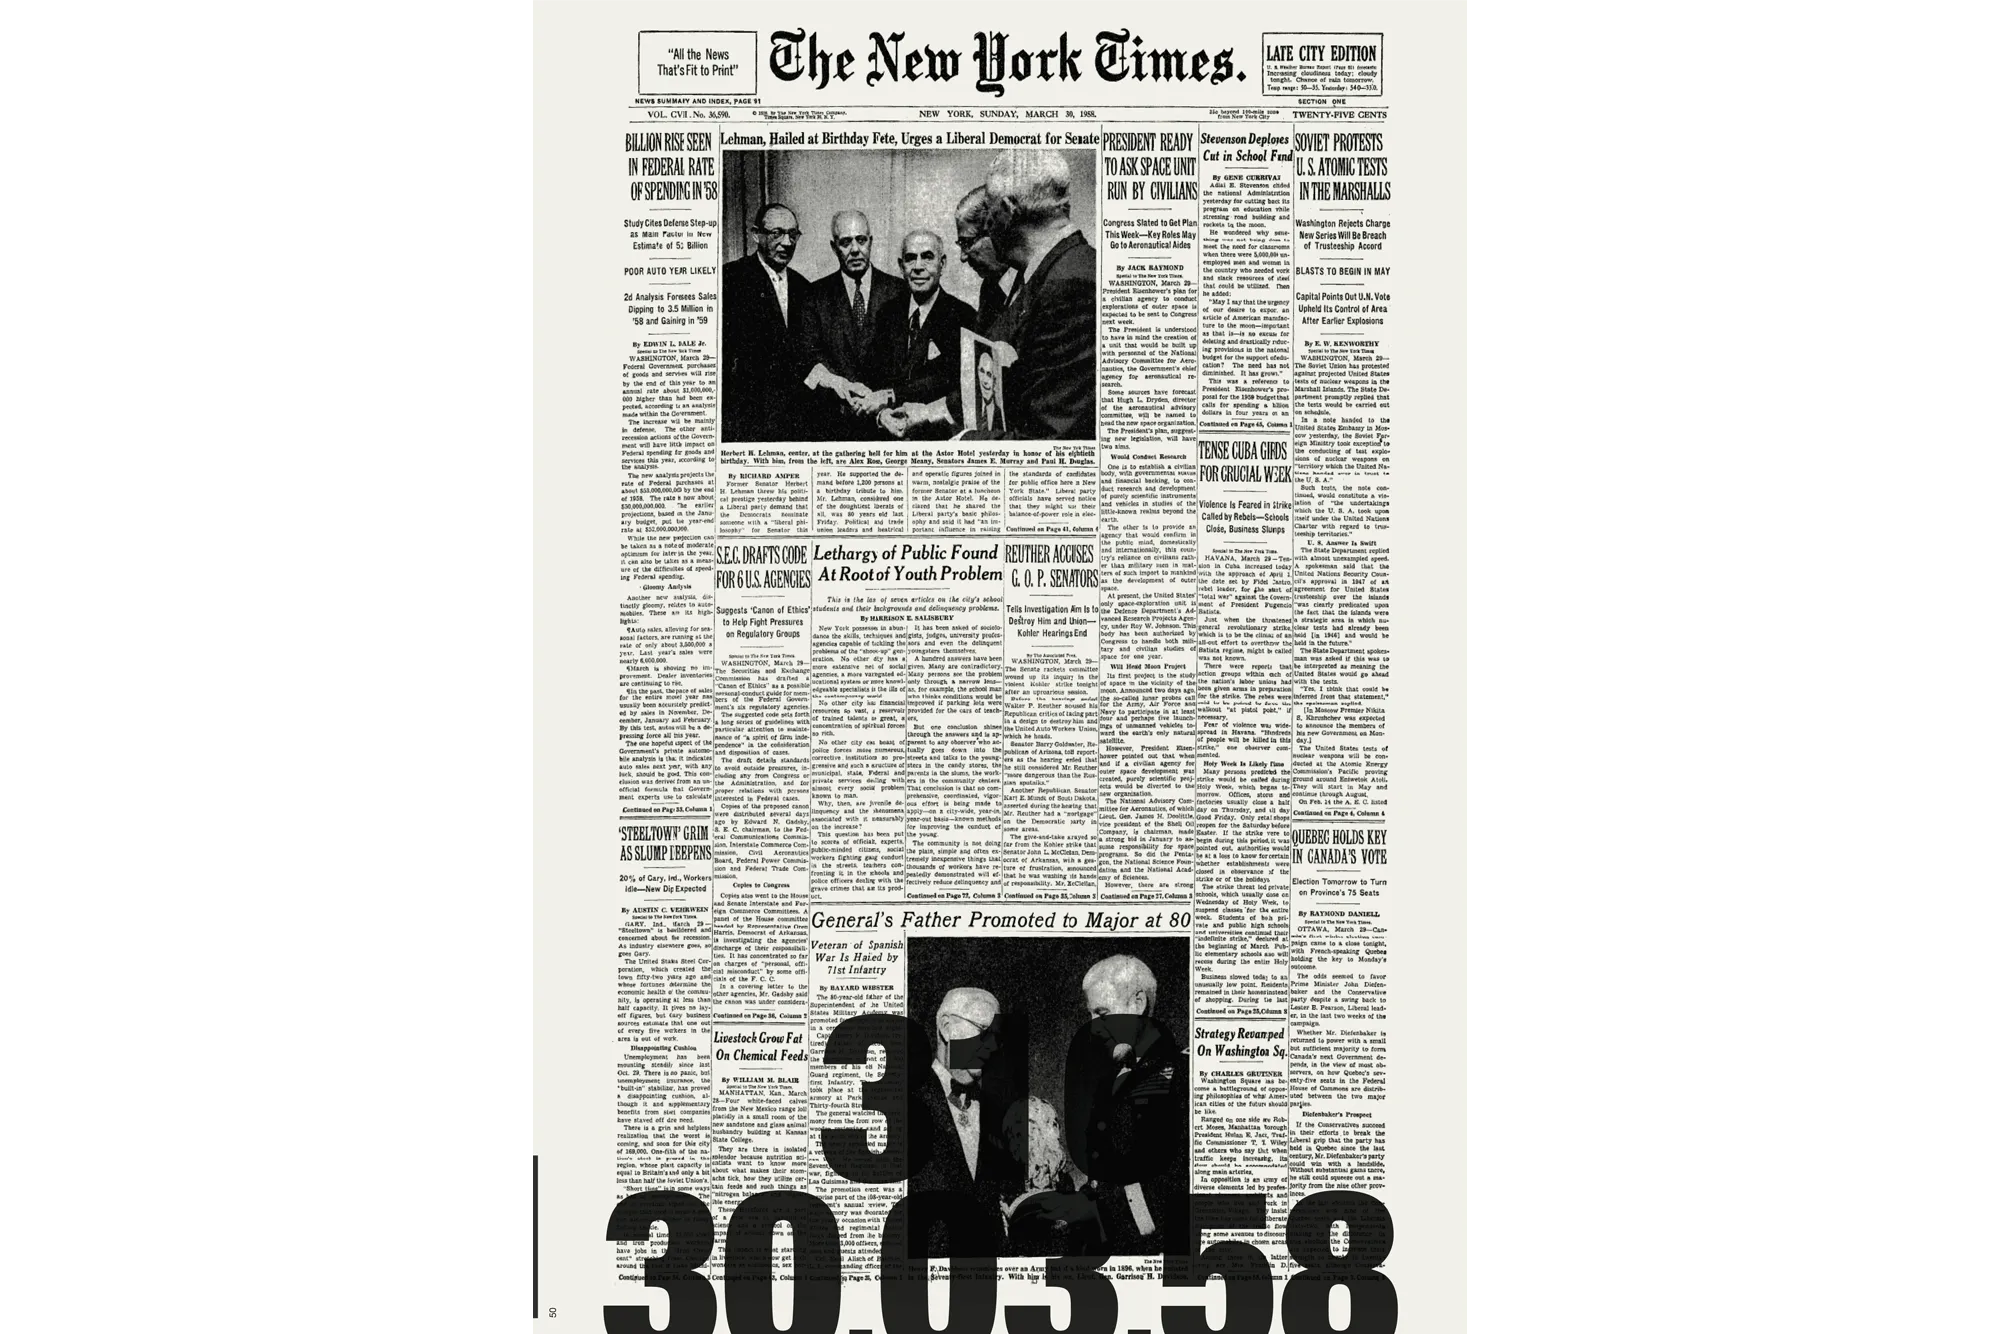
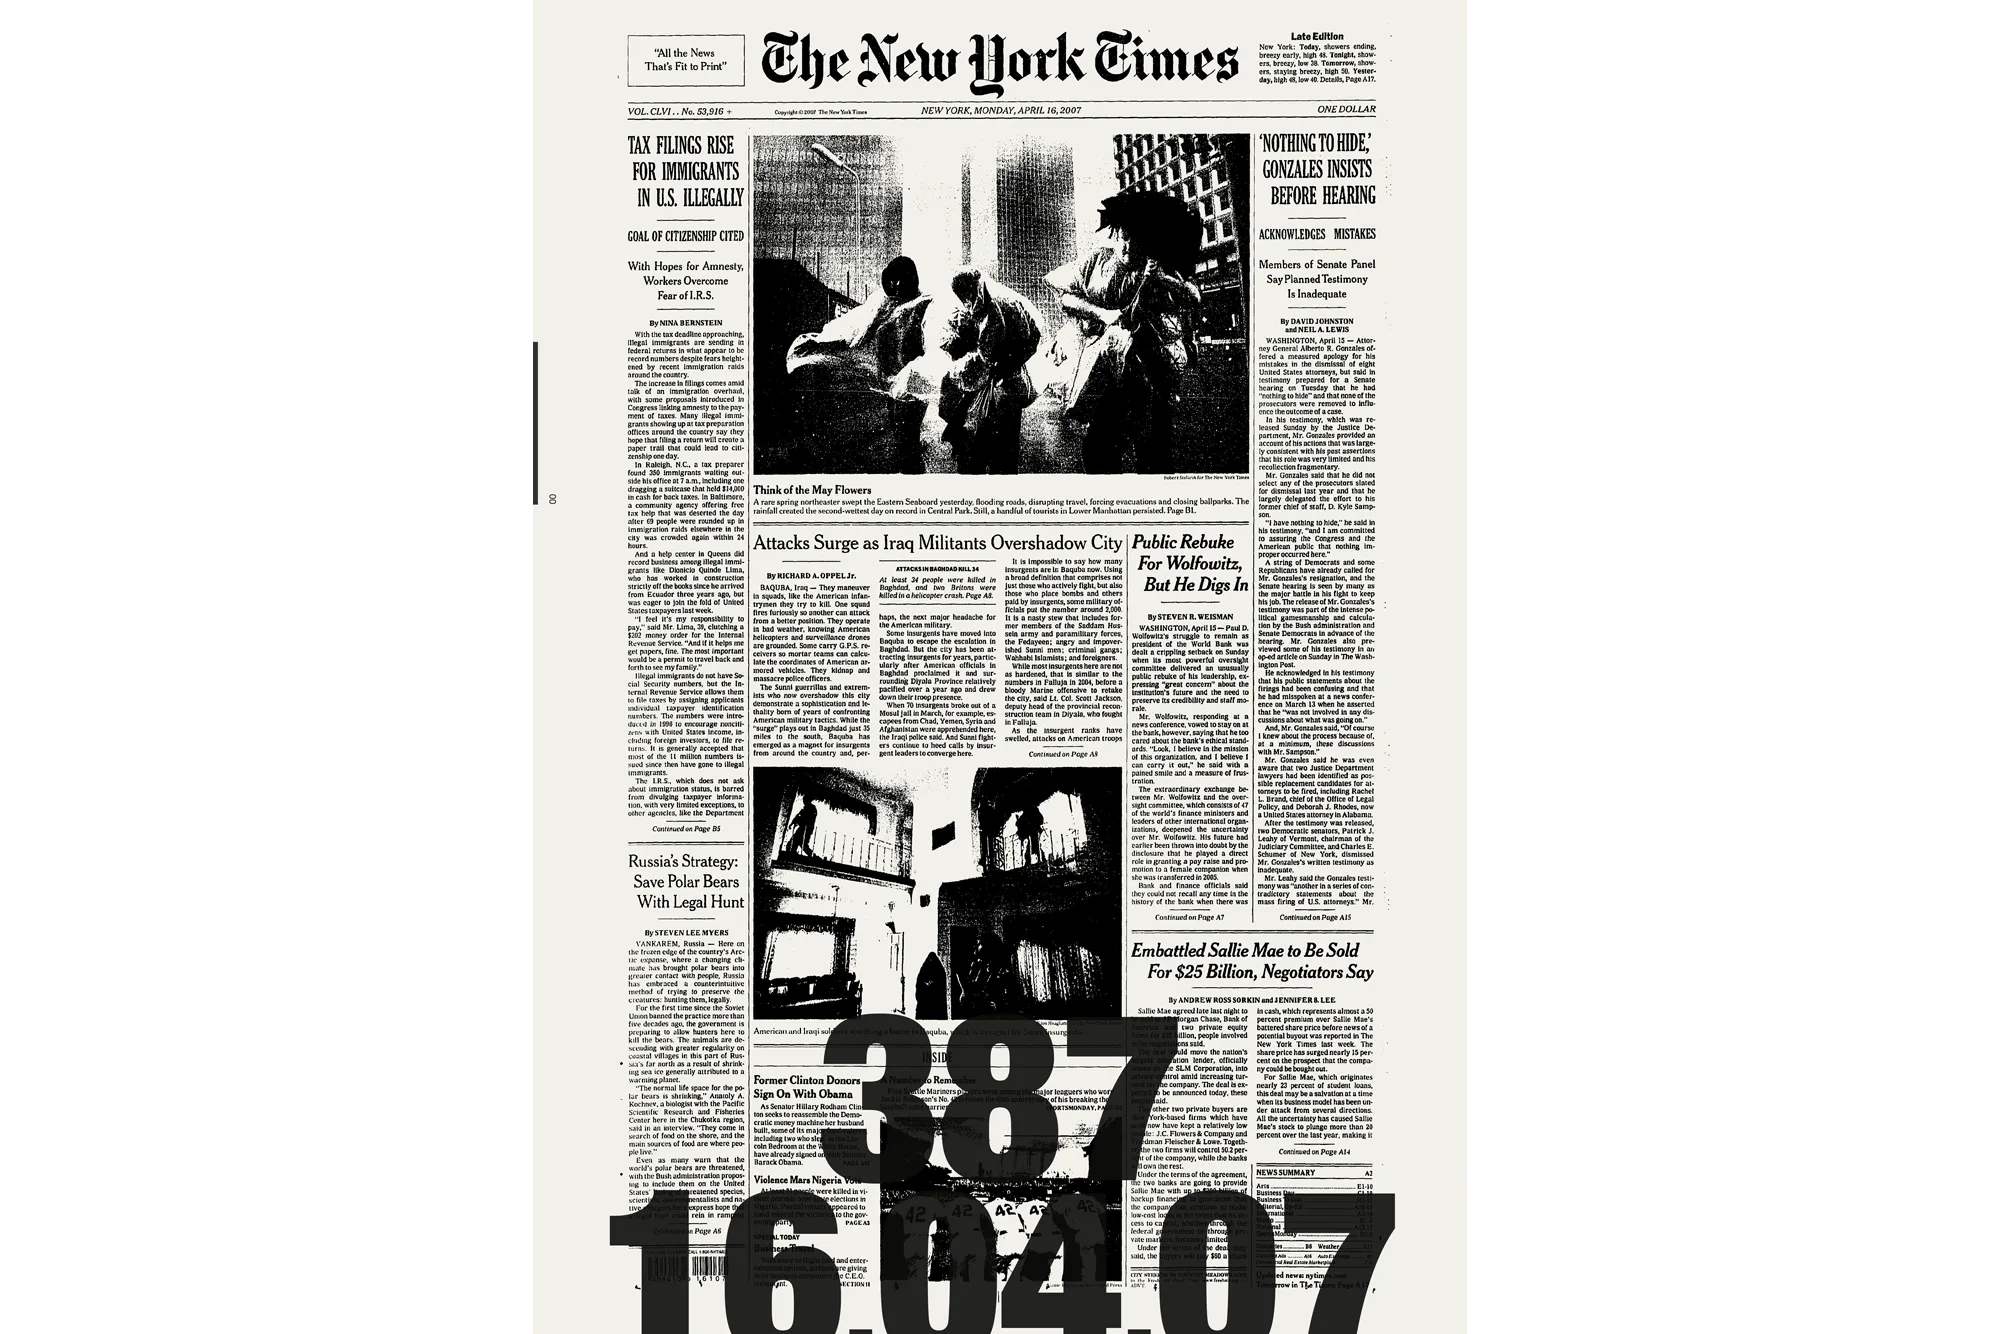
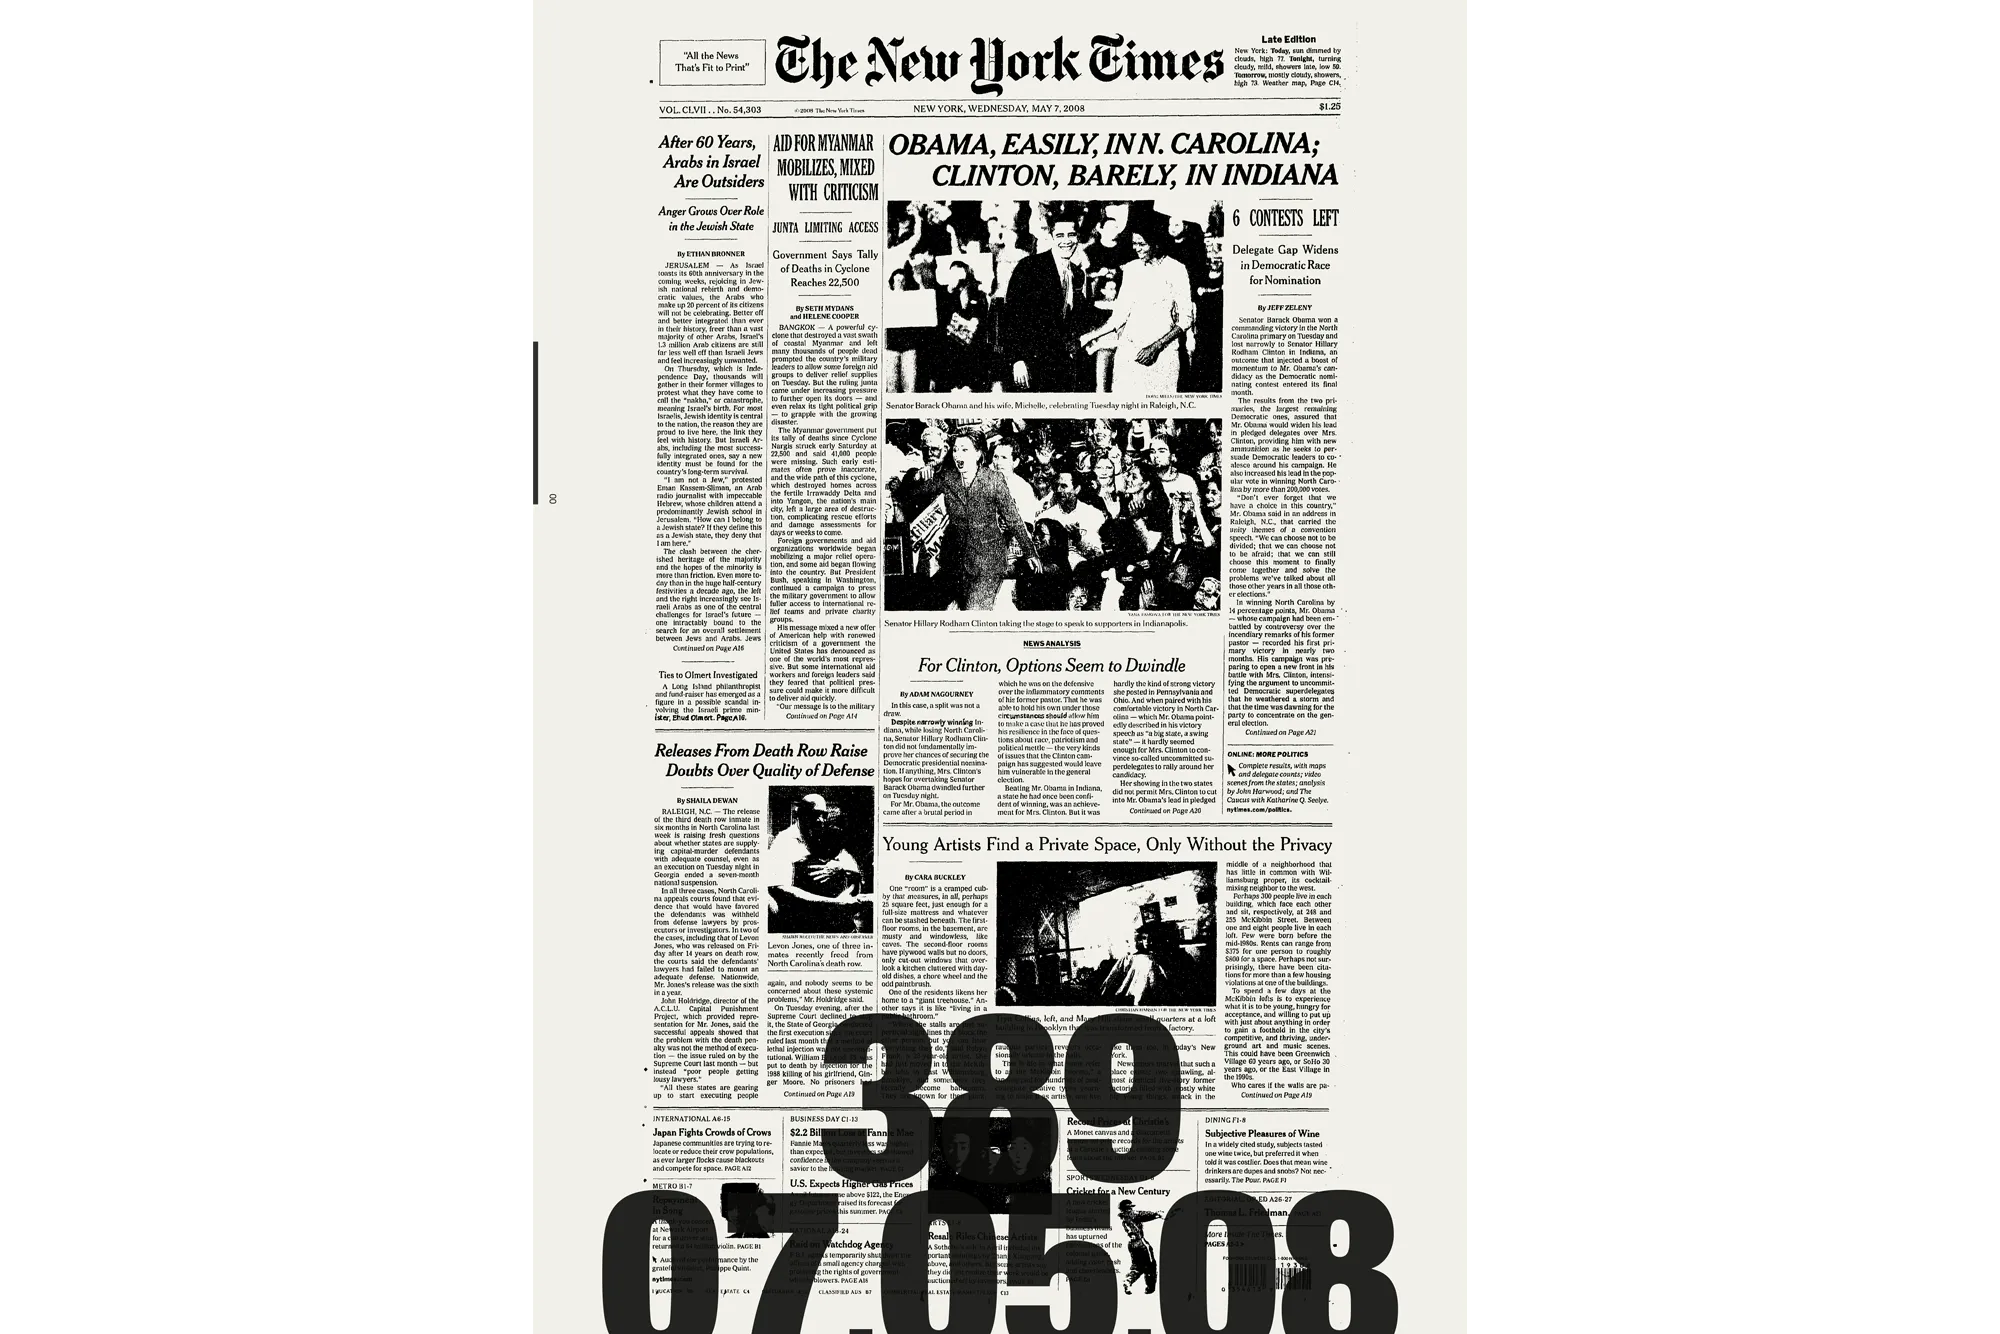
Parts per Million is a book-object designed and produced for an ongoing research series (01) exploring key dates in the climate crisis. This edition focuses on the New York Times — gathering front pages from significant dates into an archival folio that can be read from multiple angles.
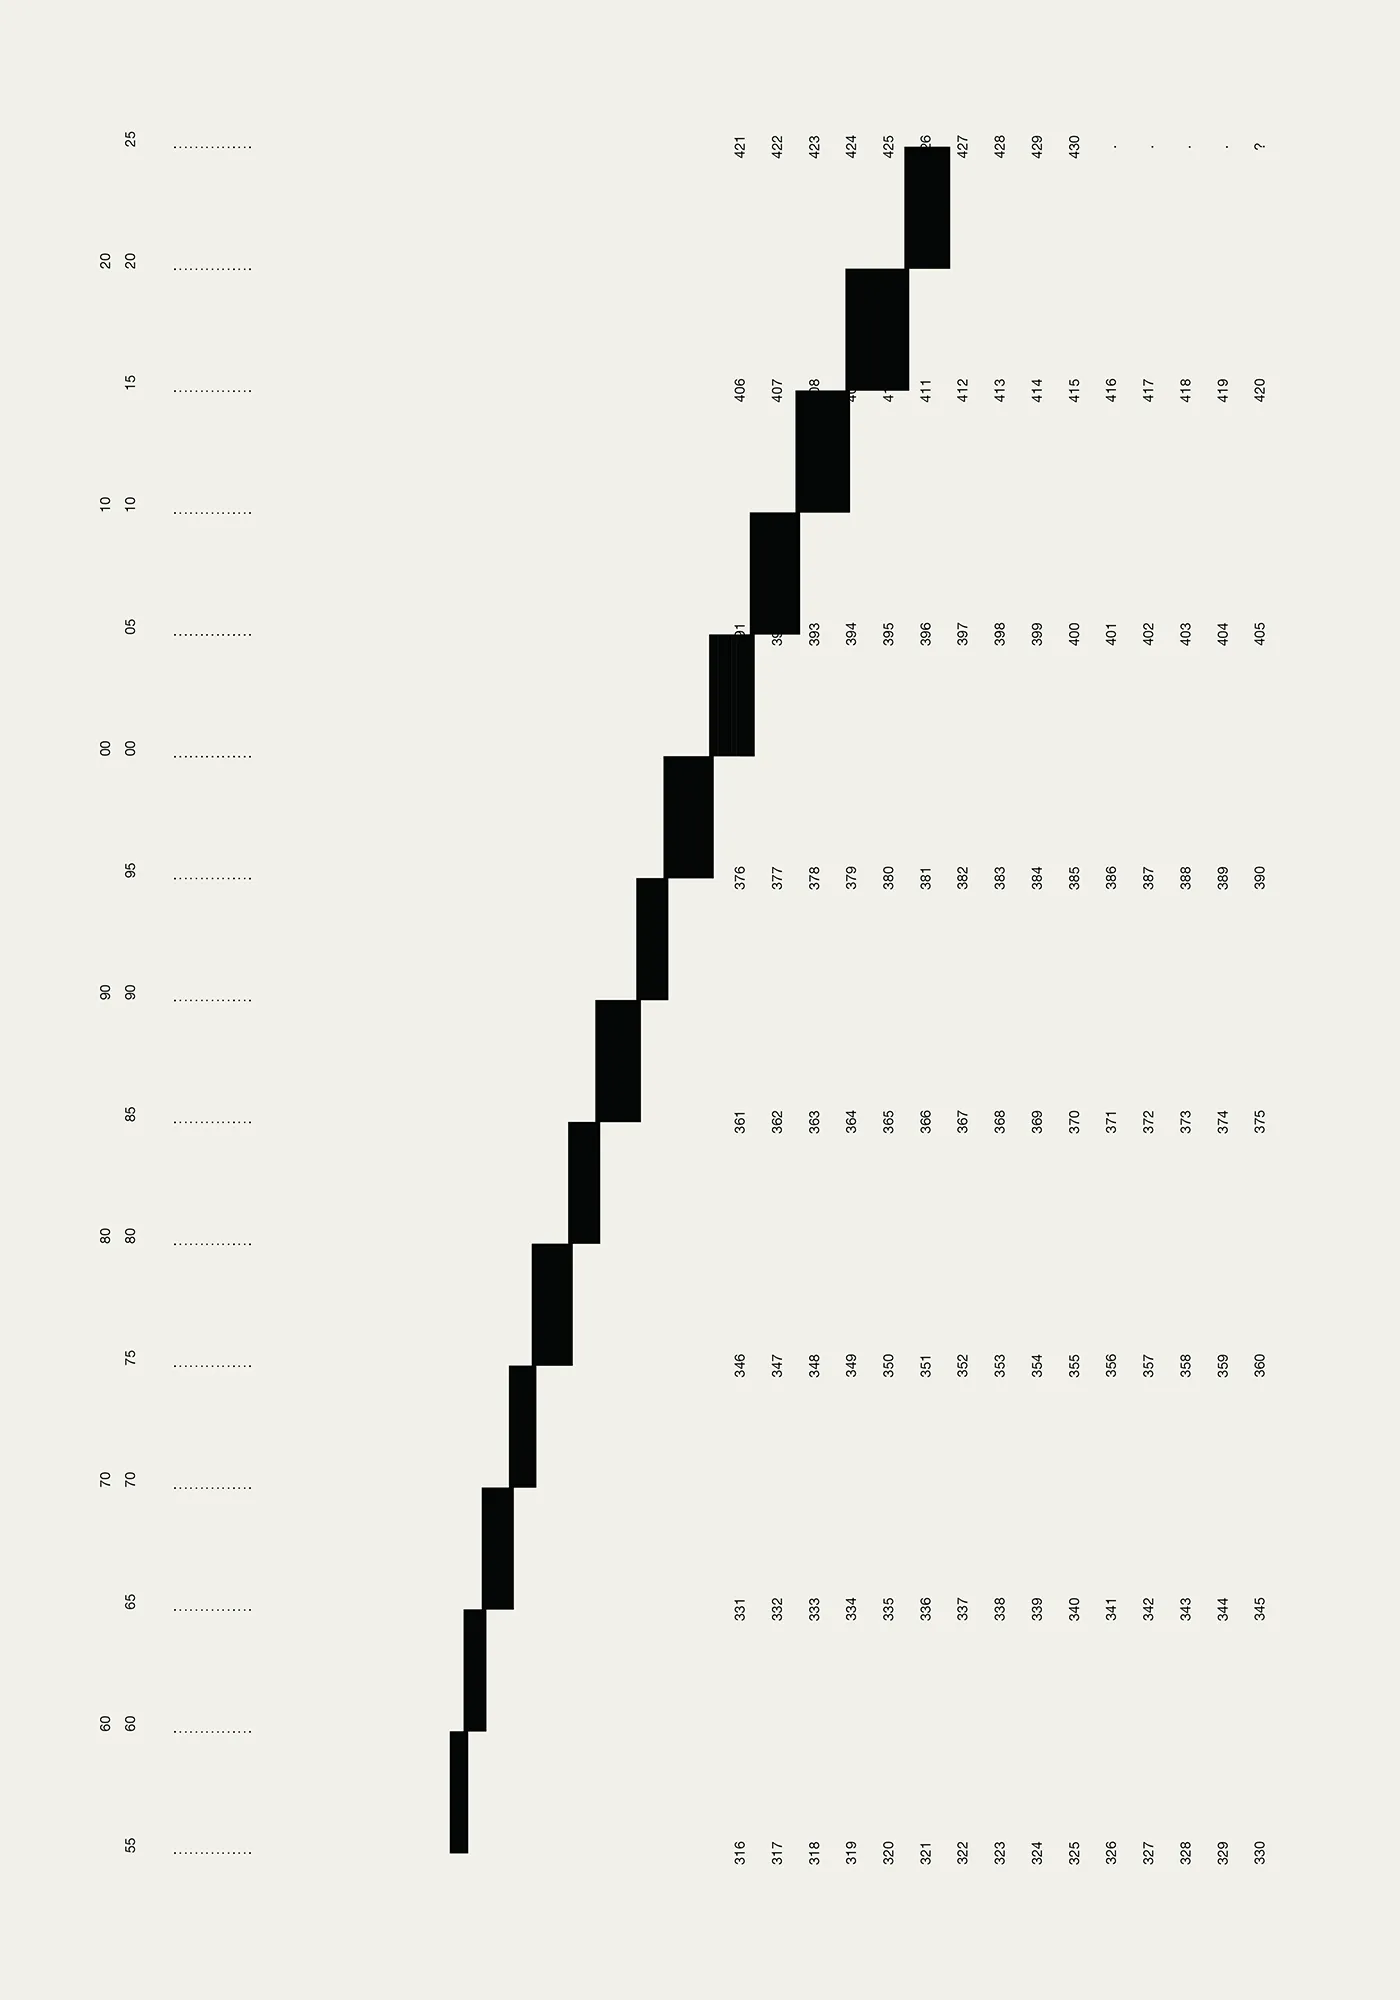
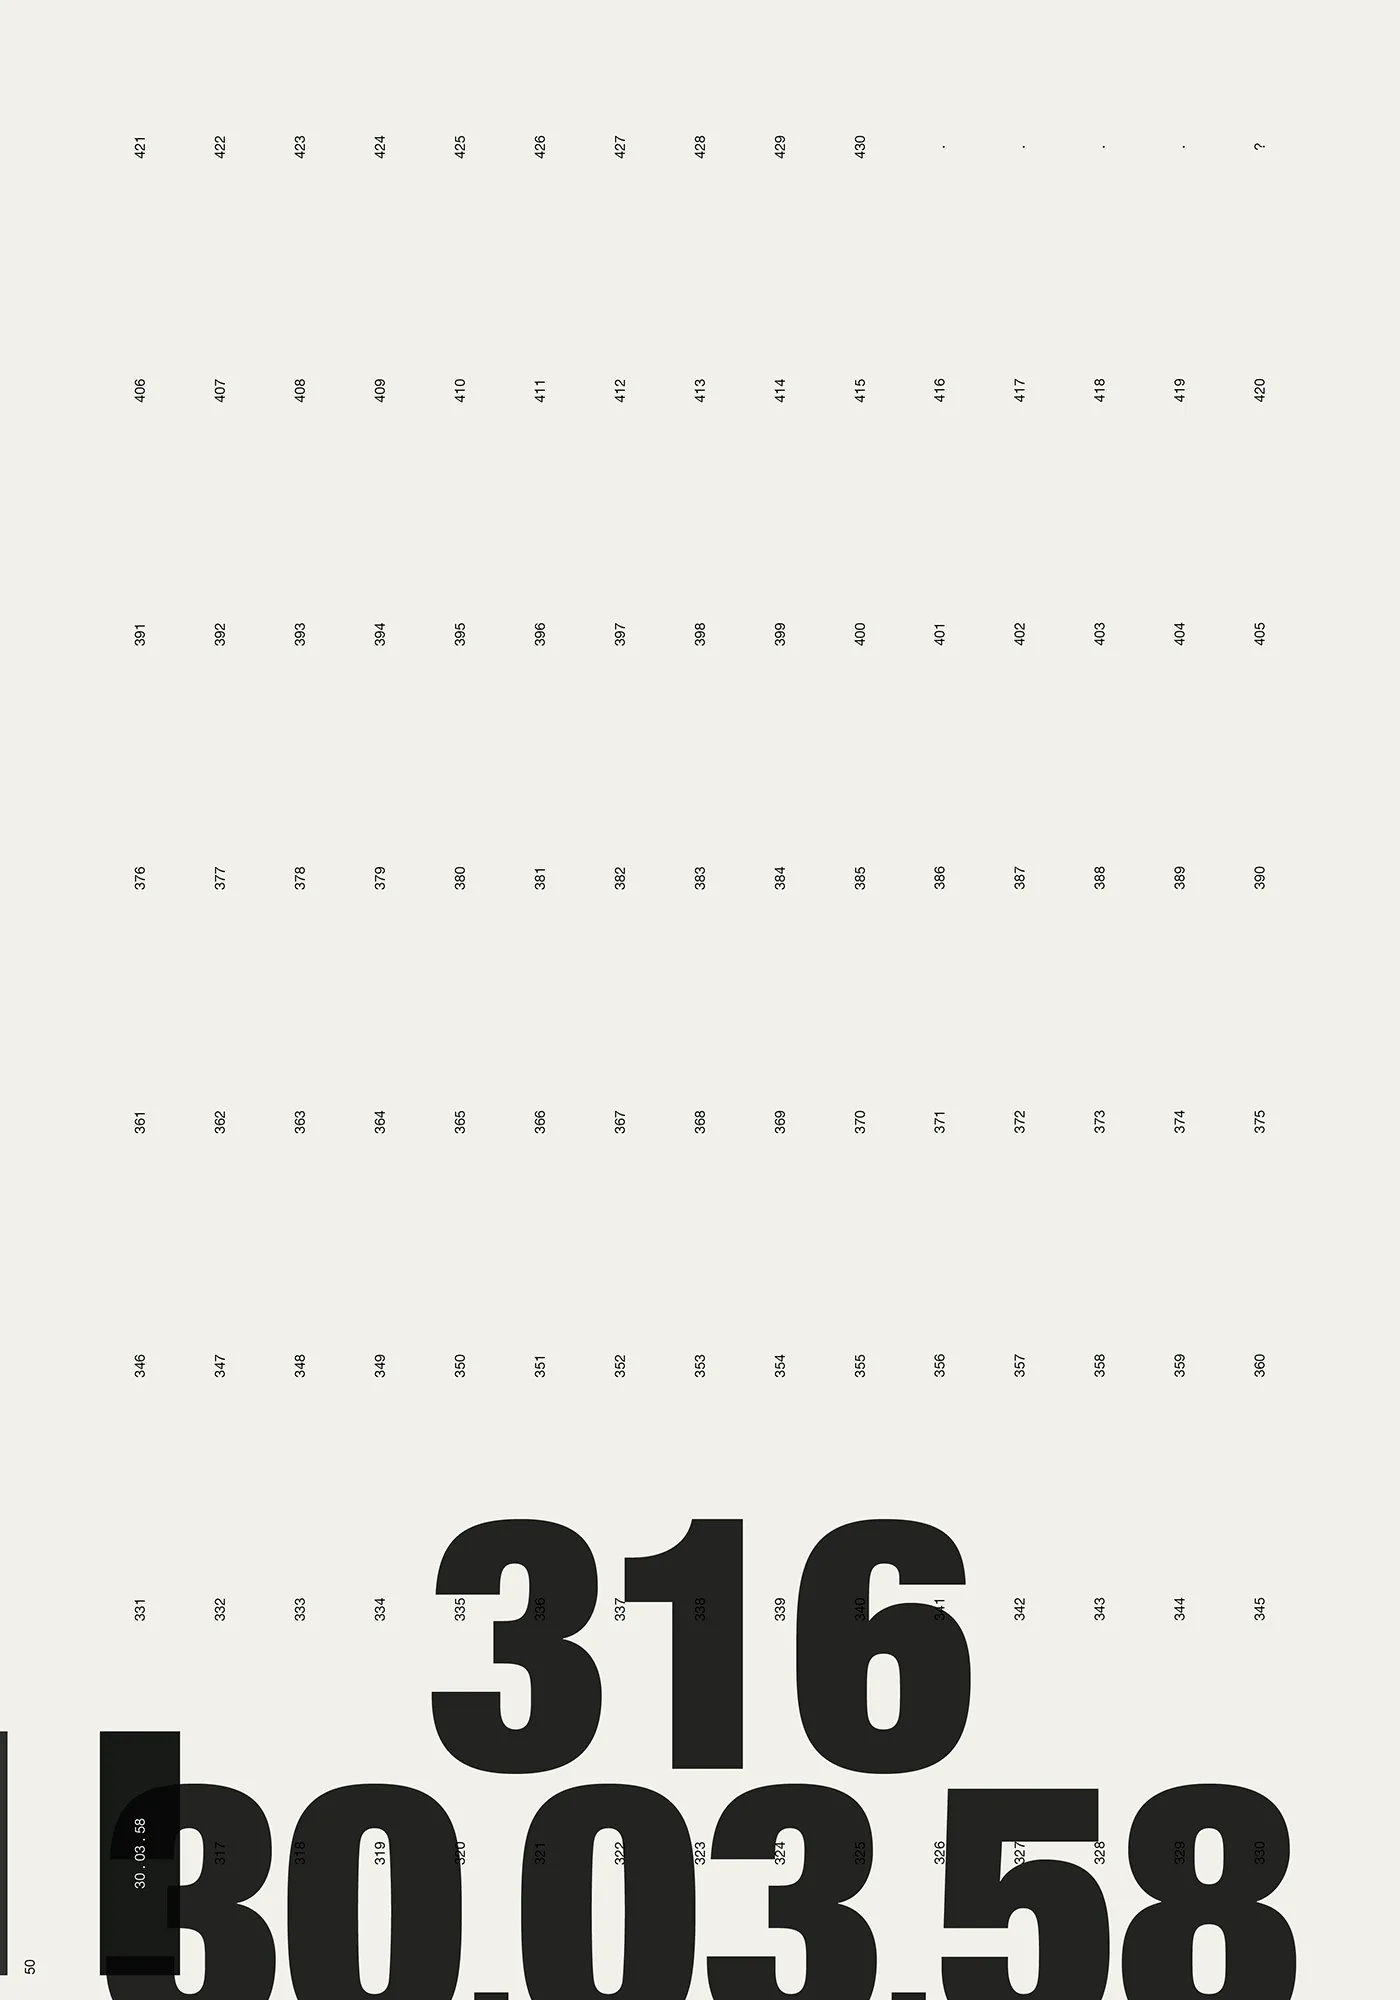
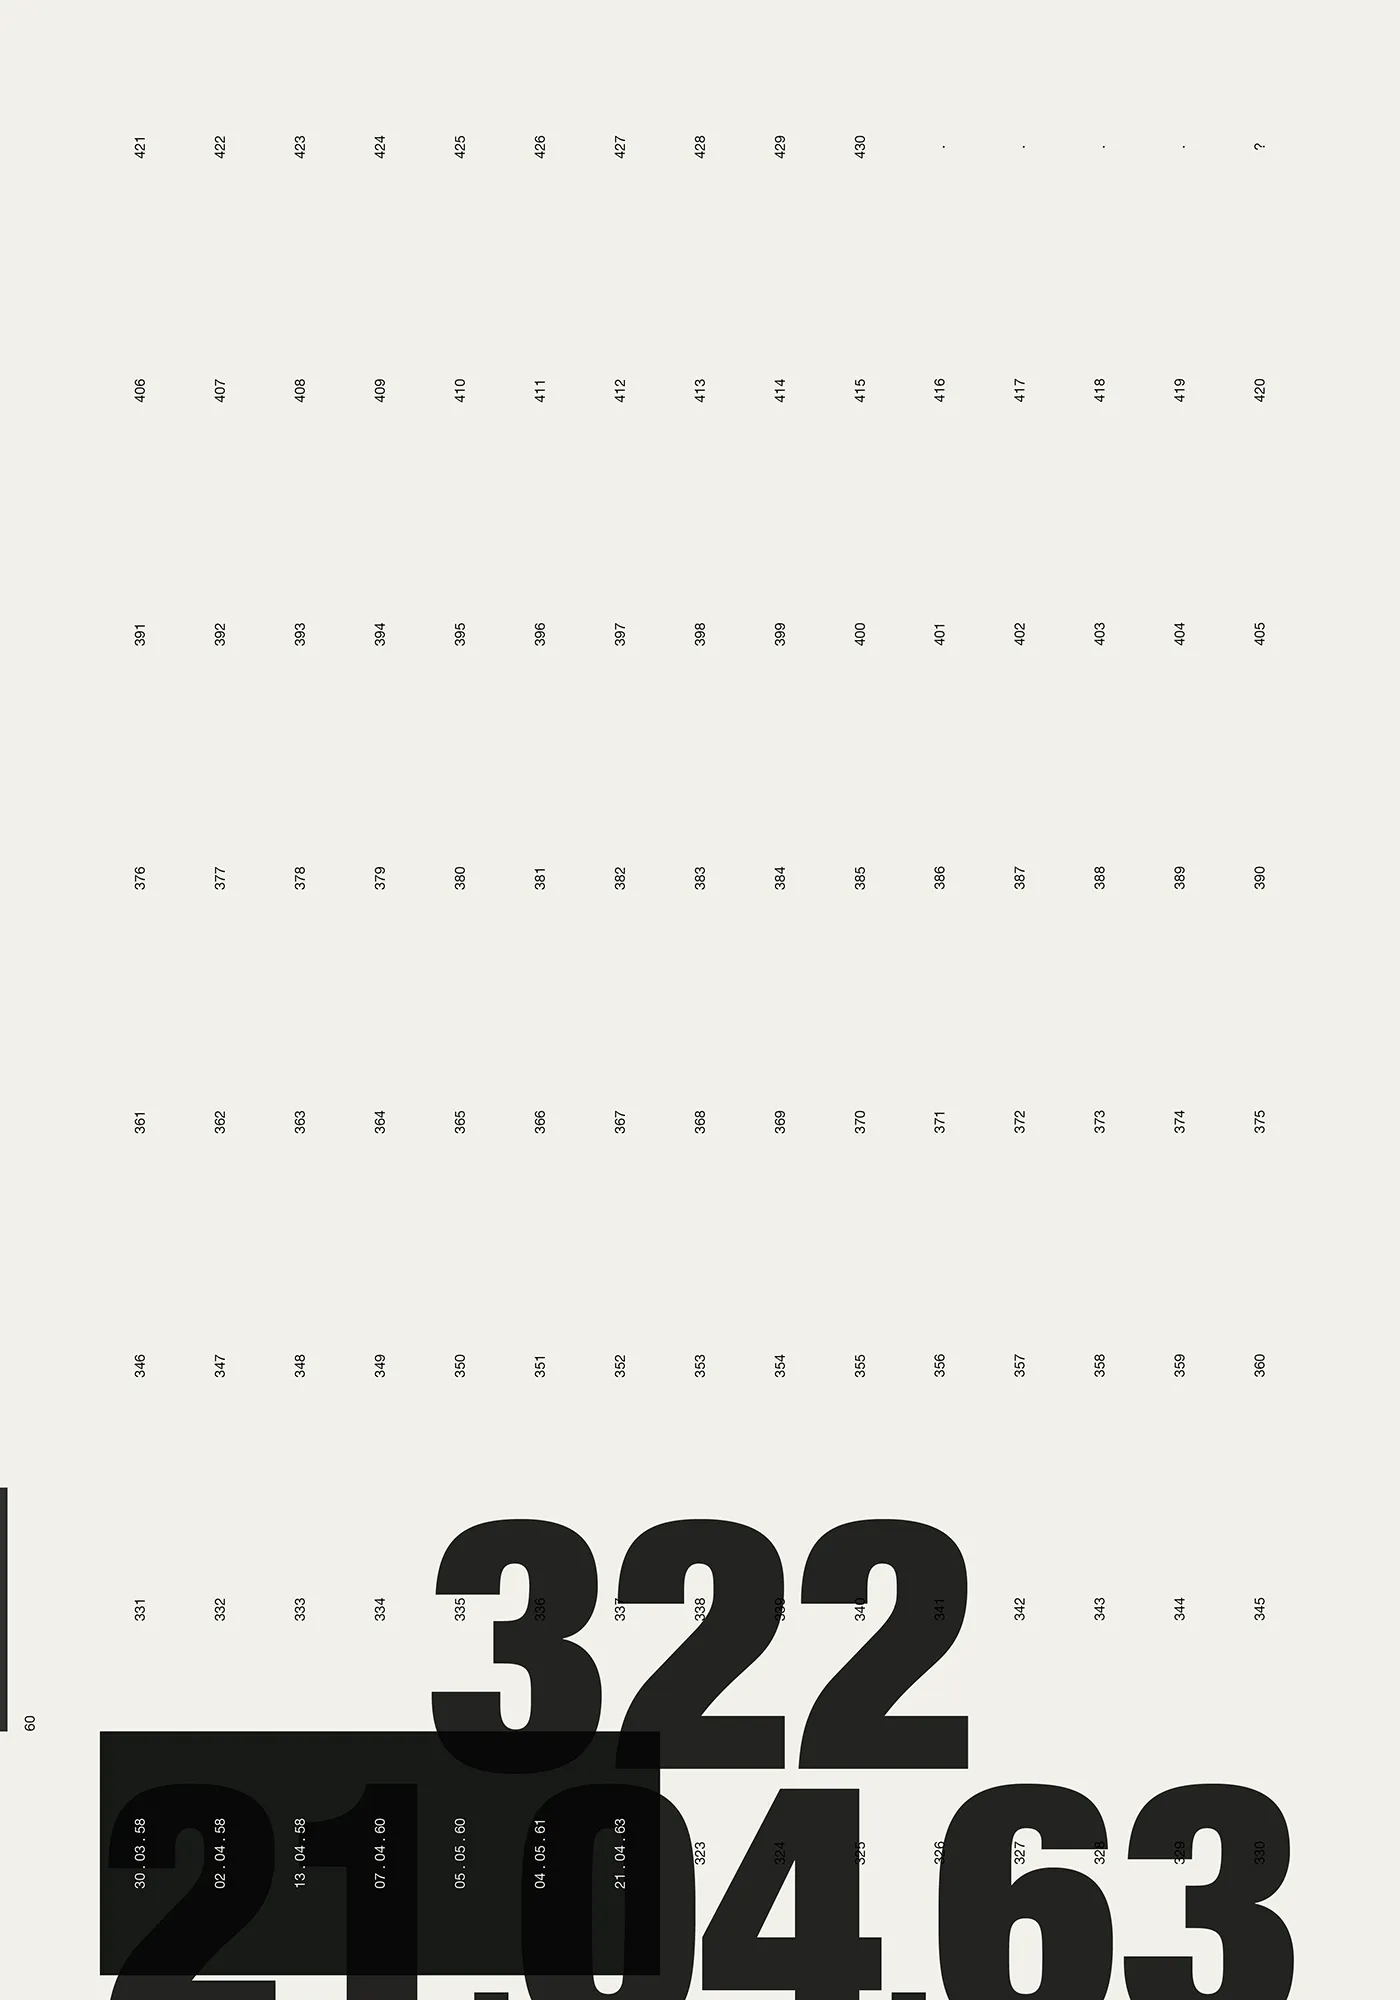
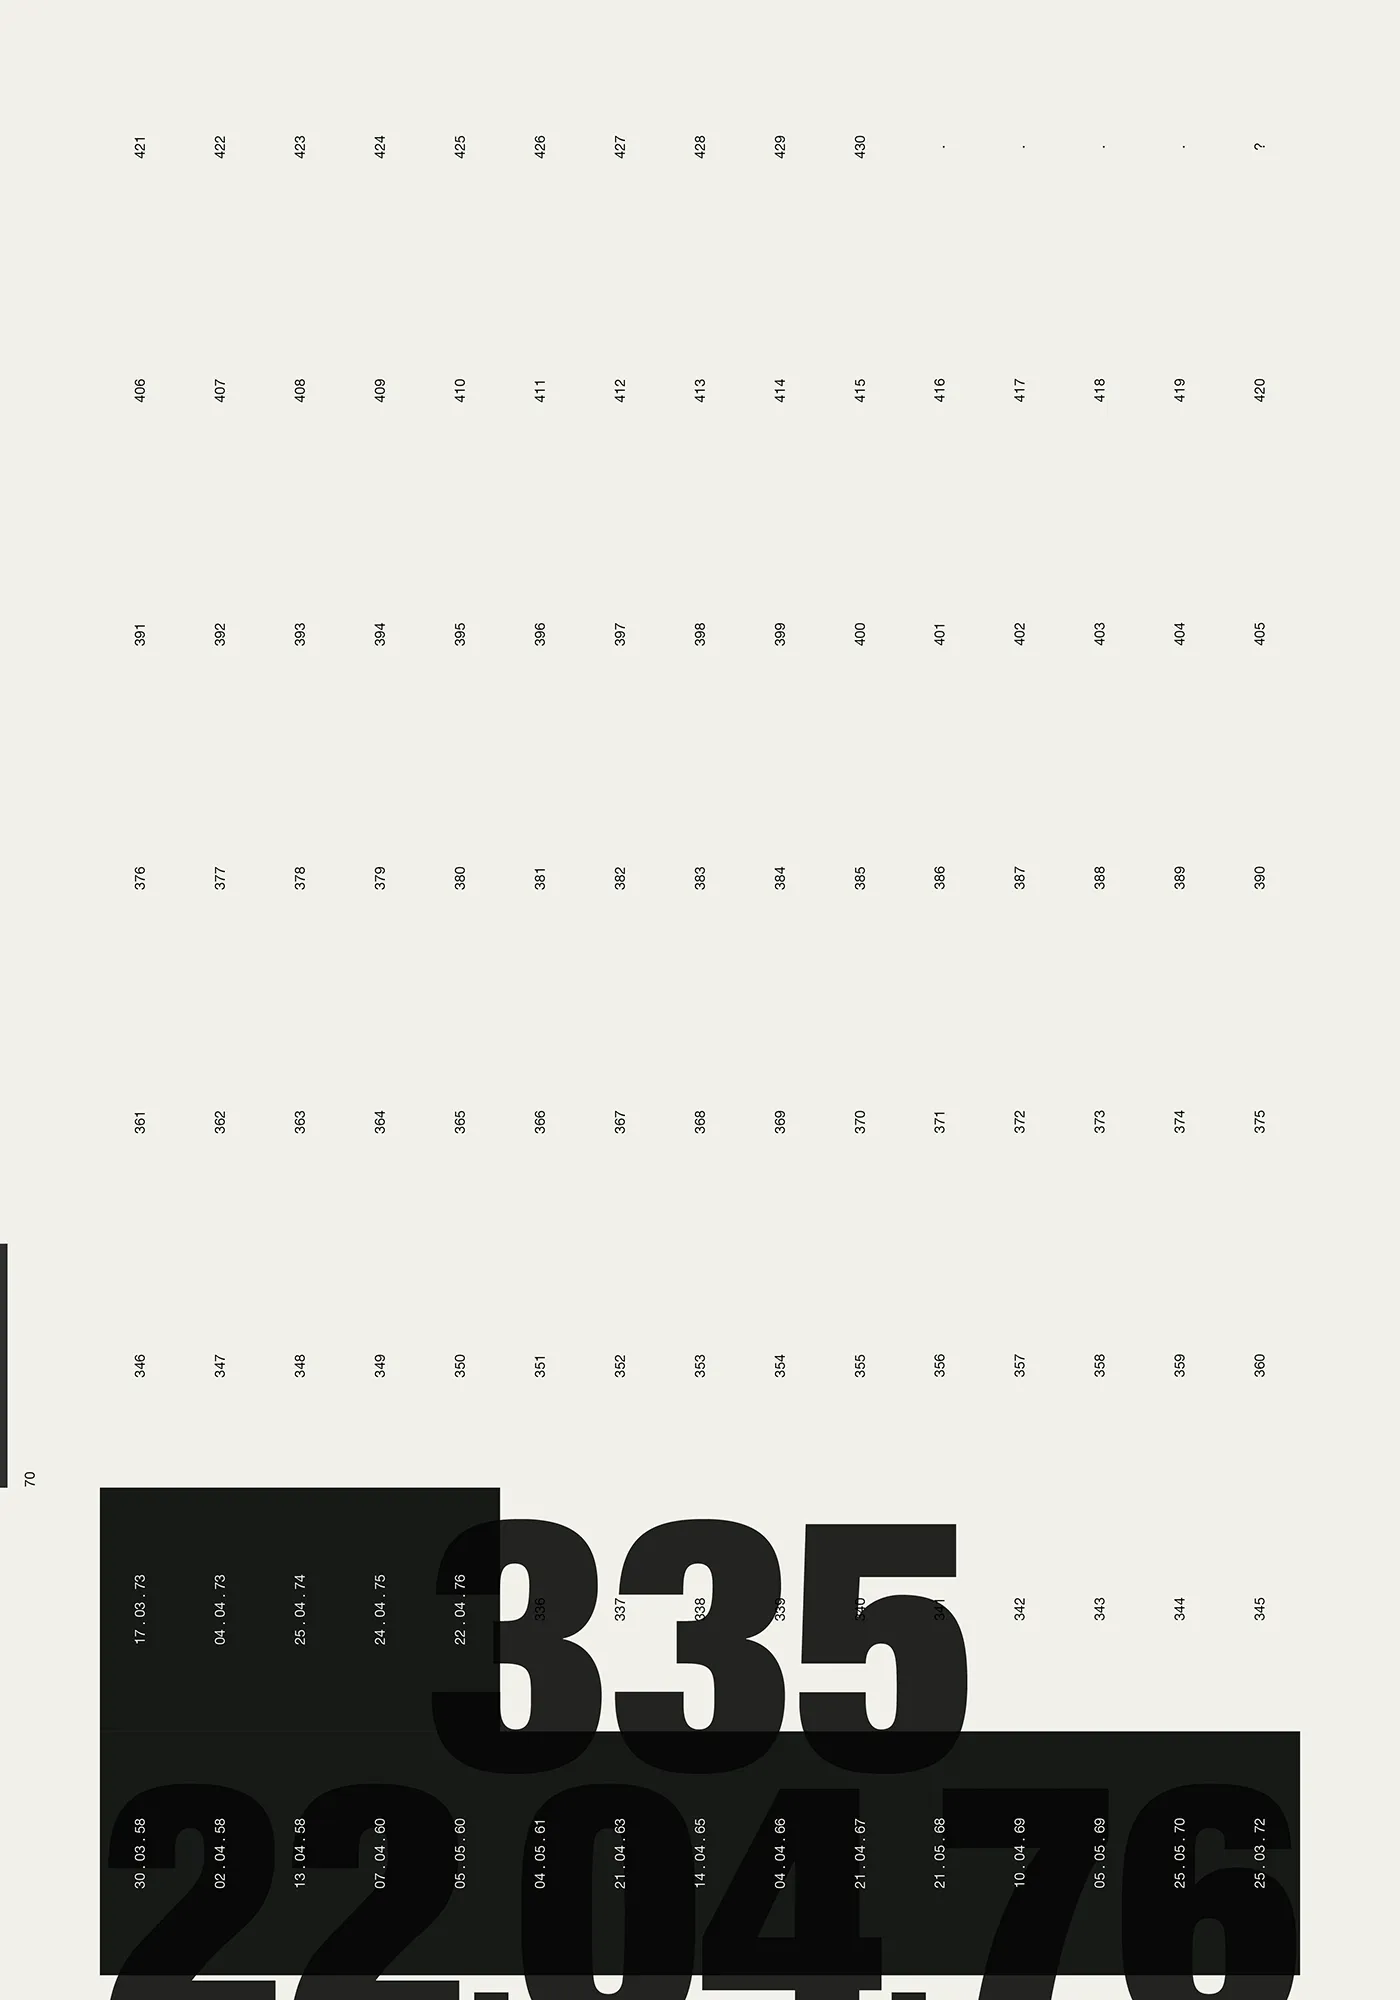
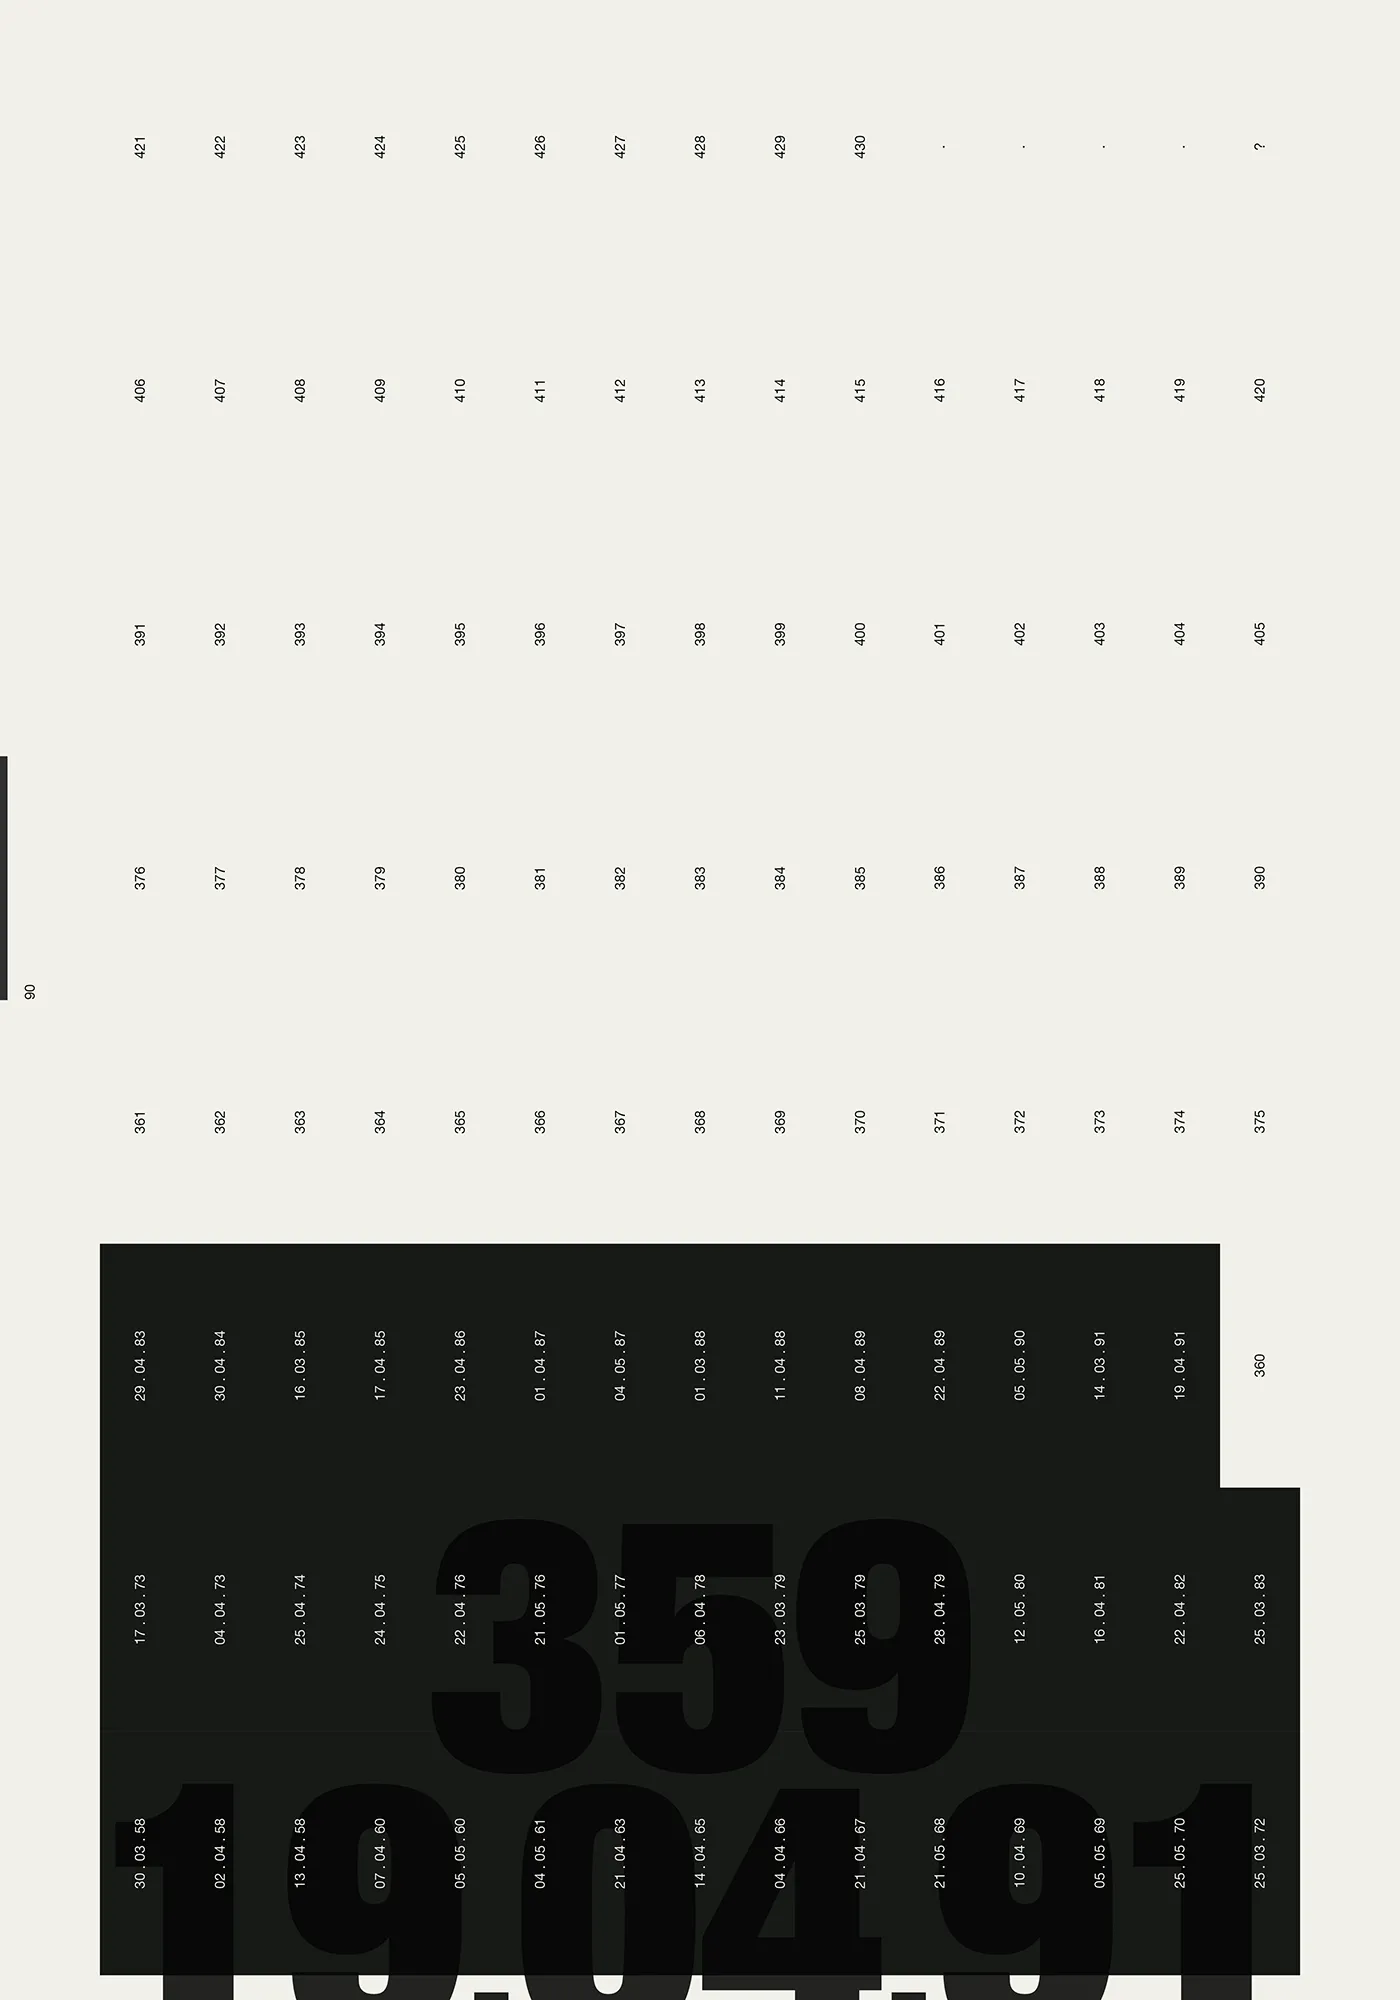
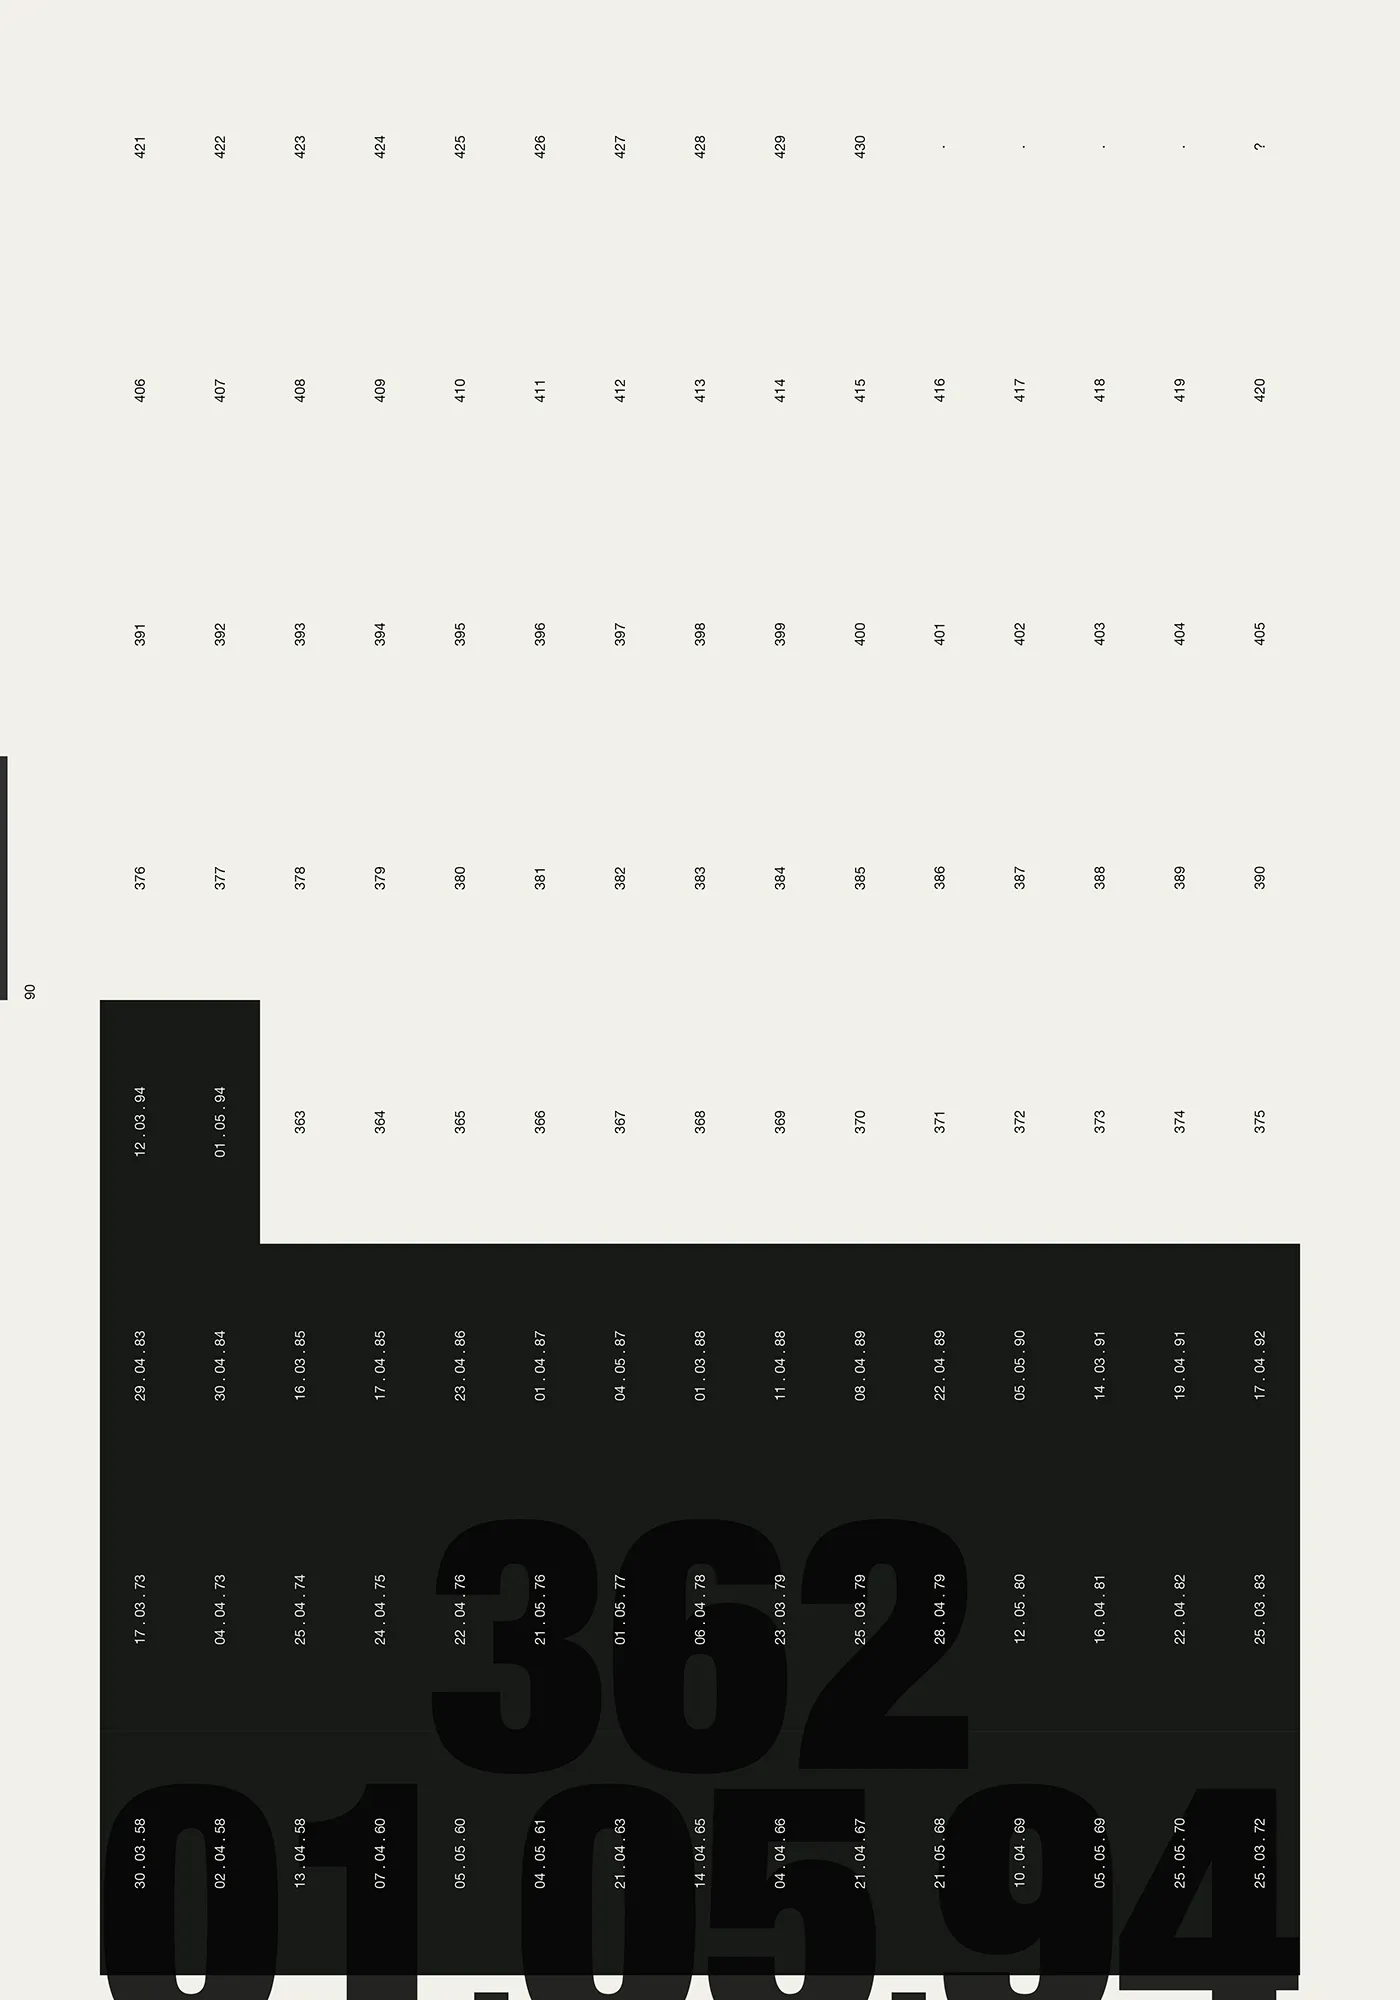
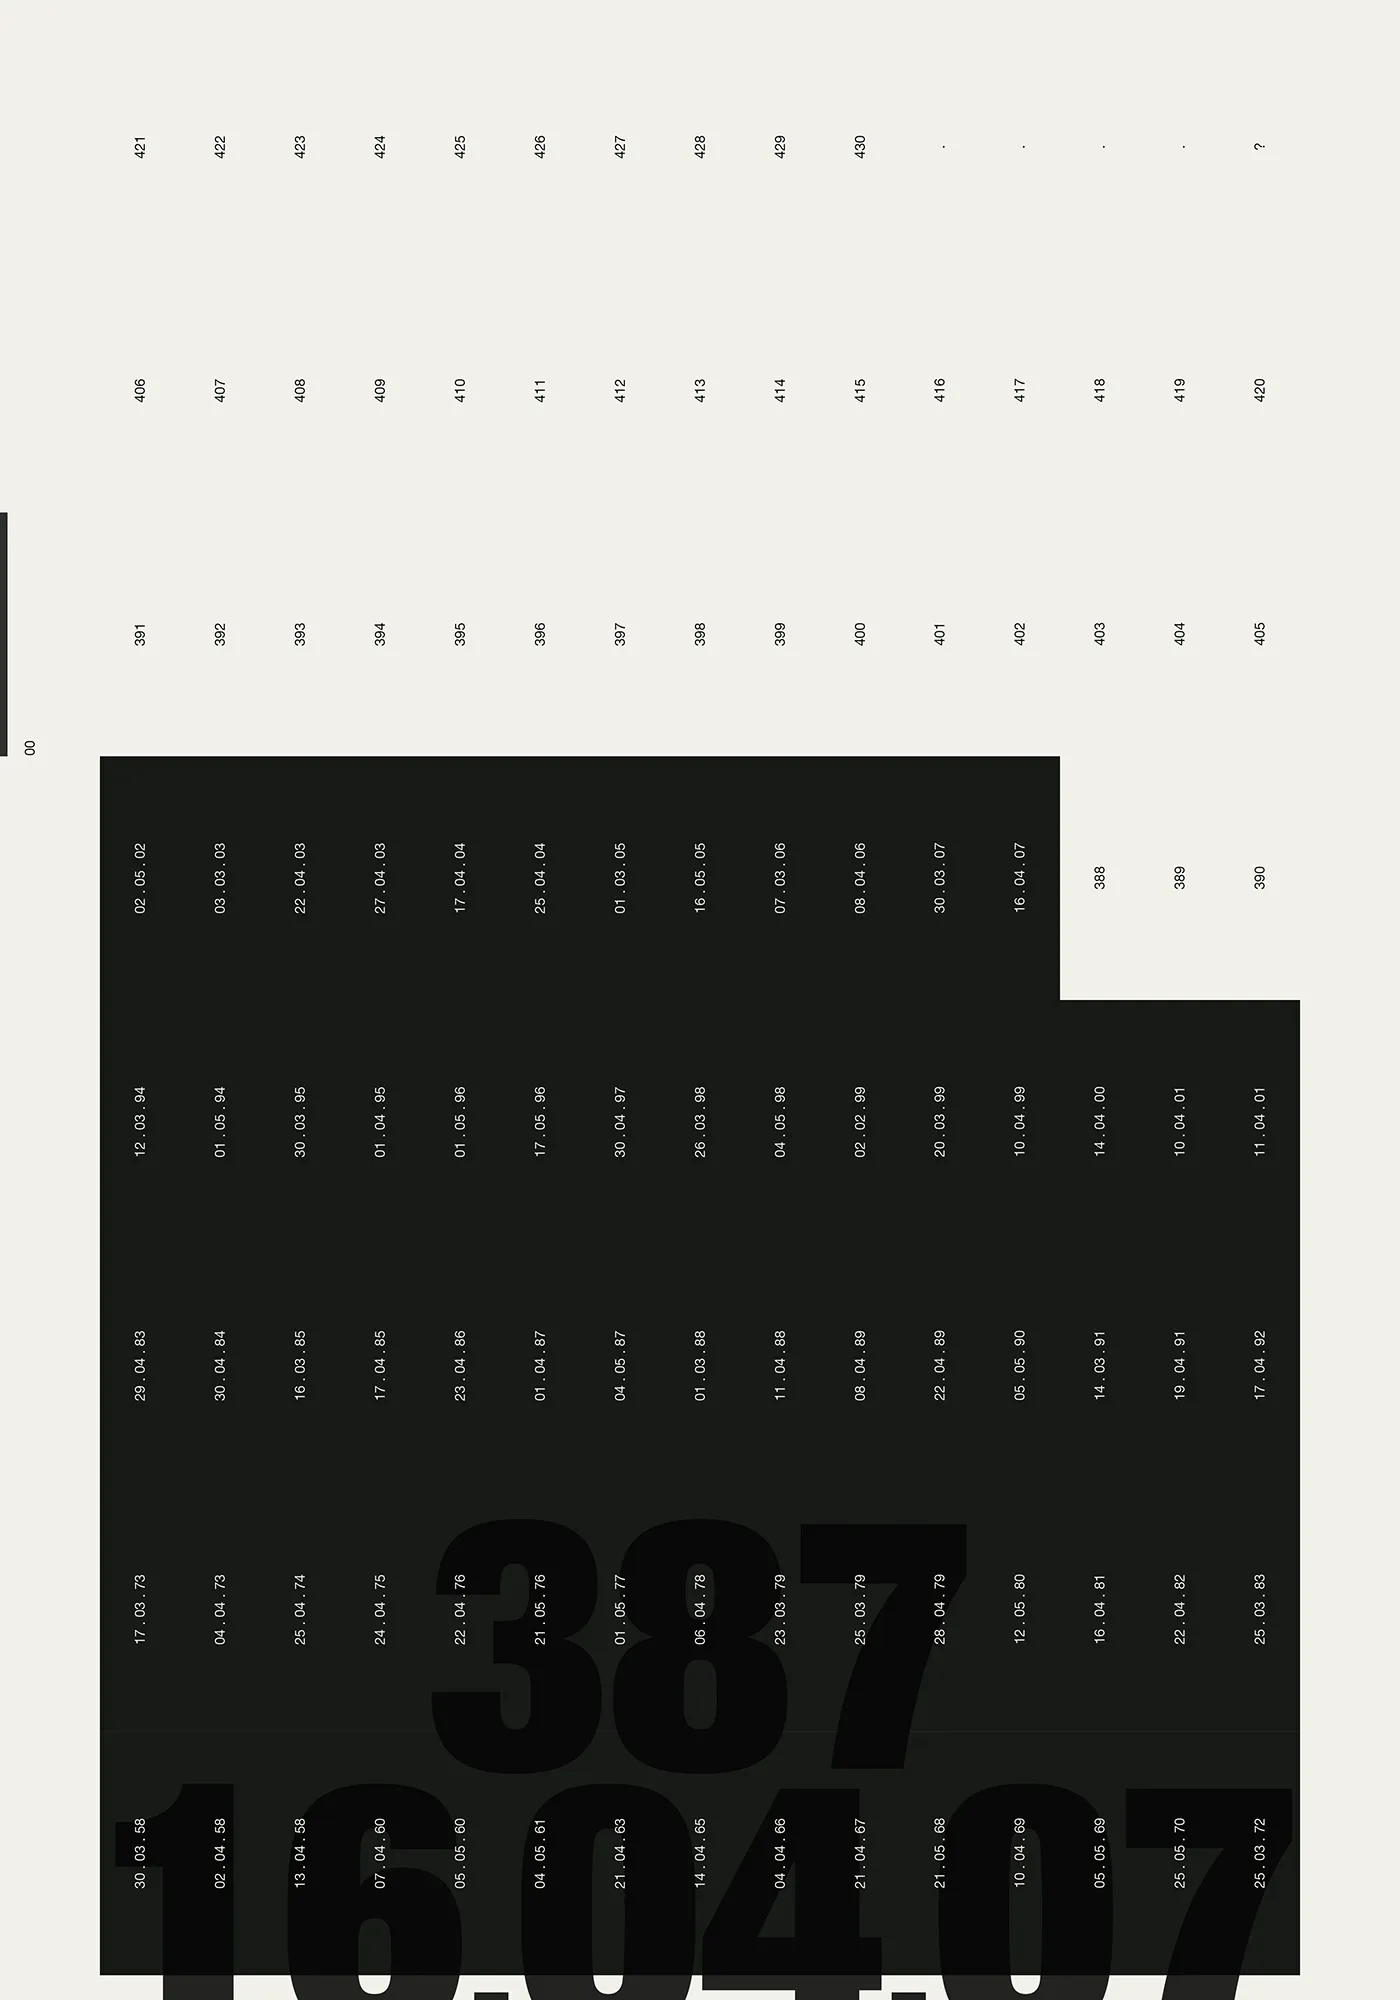
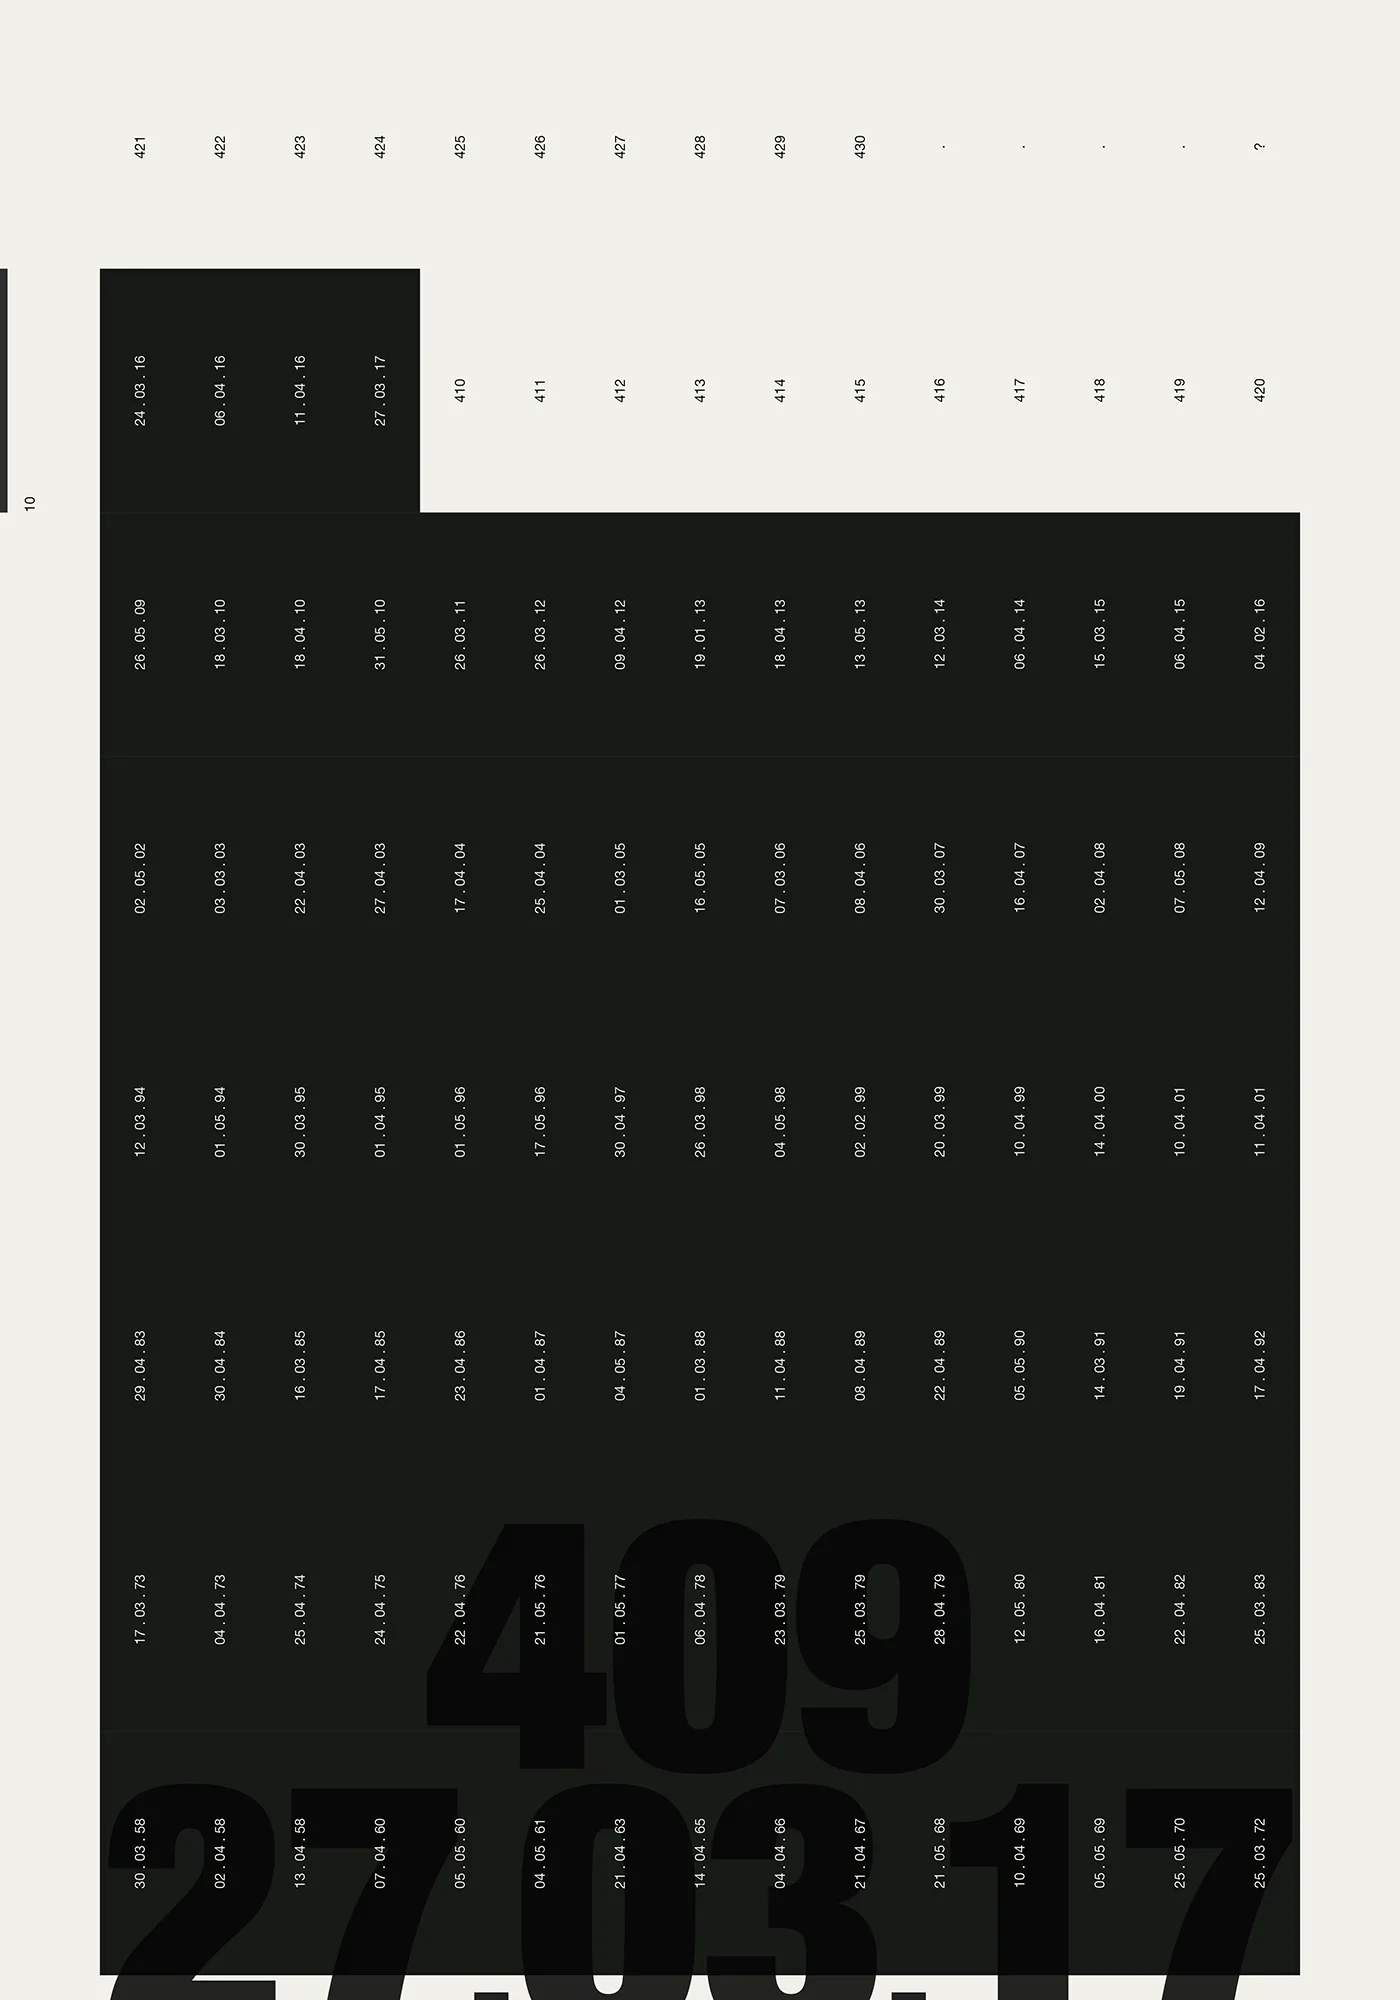
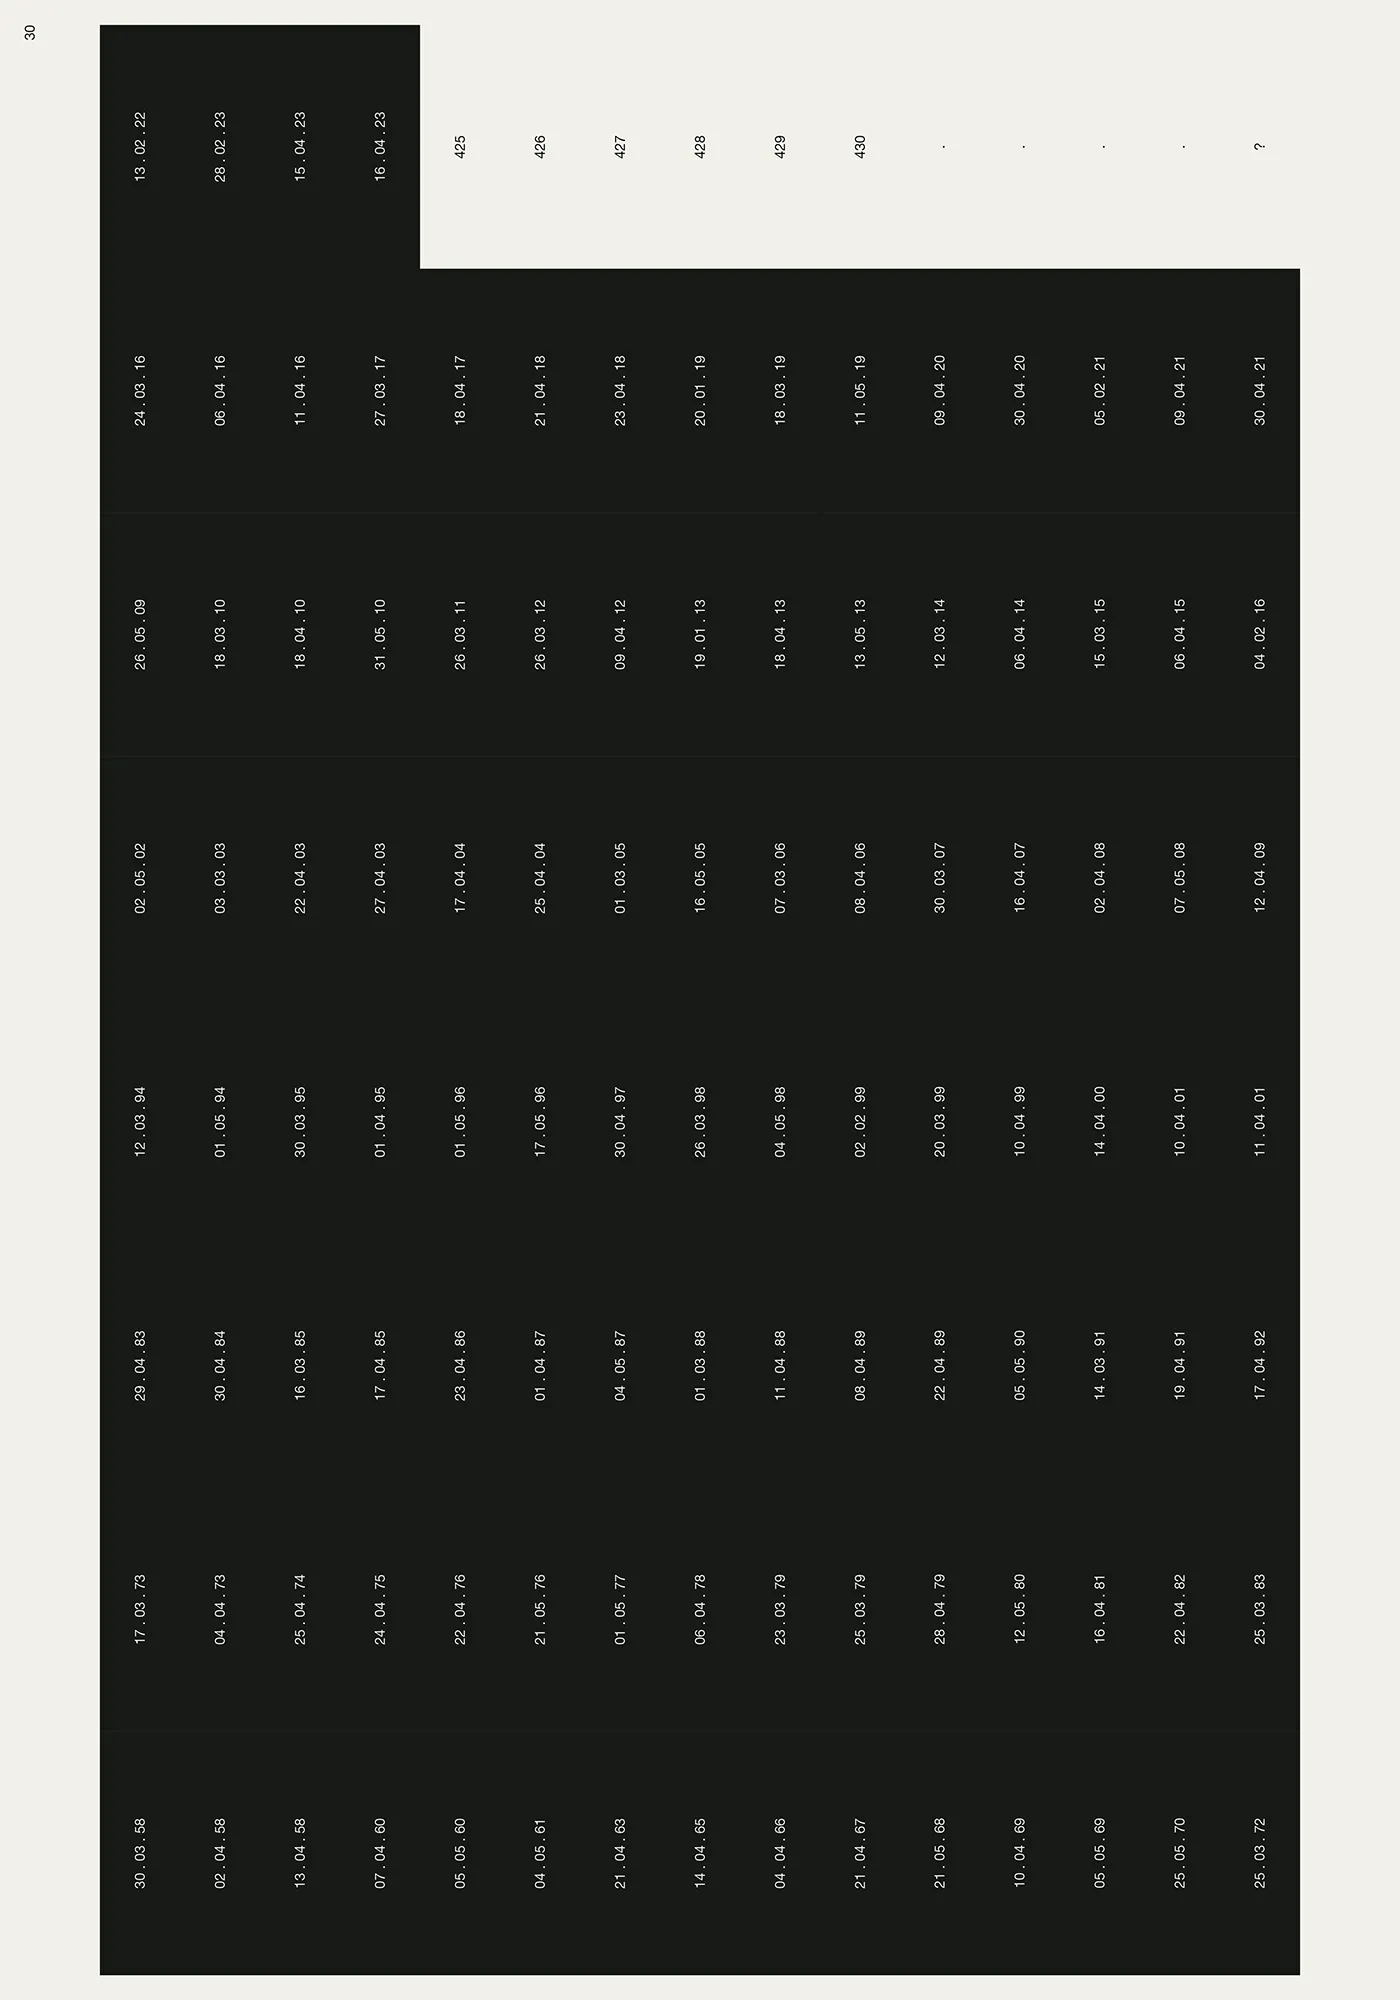
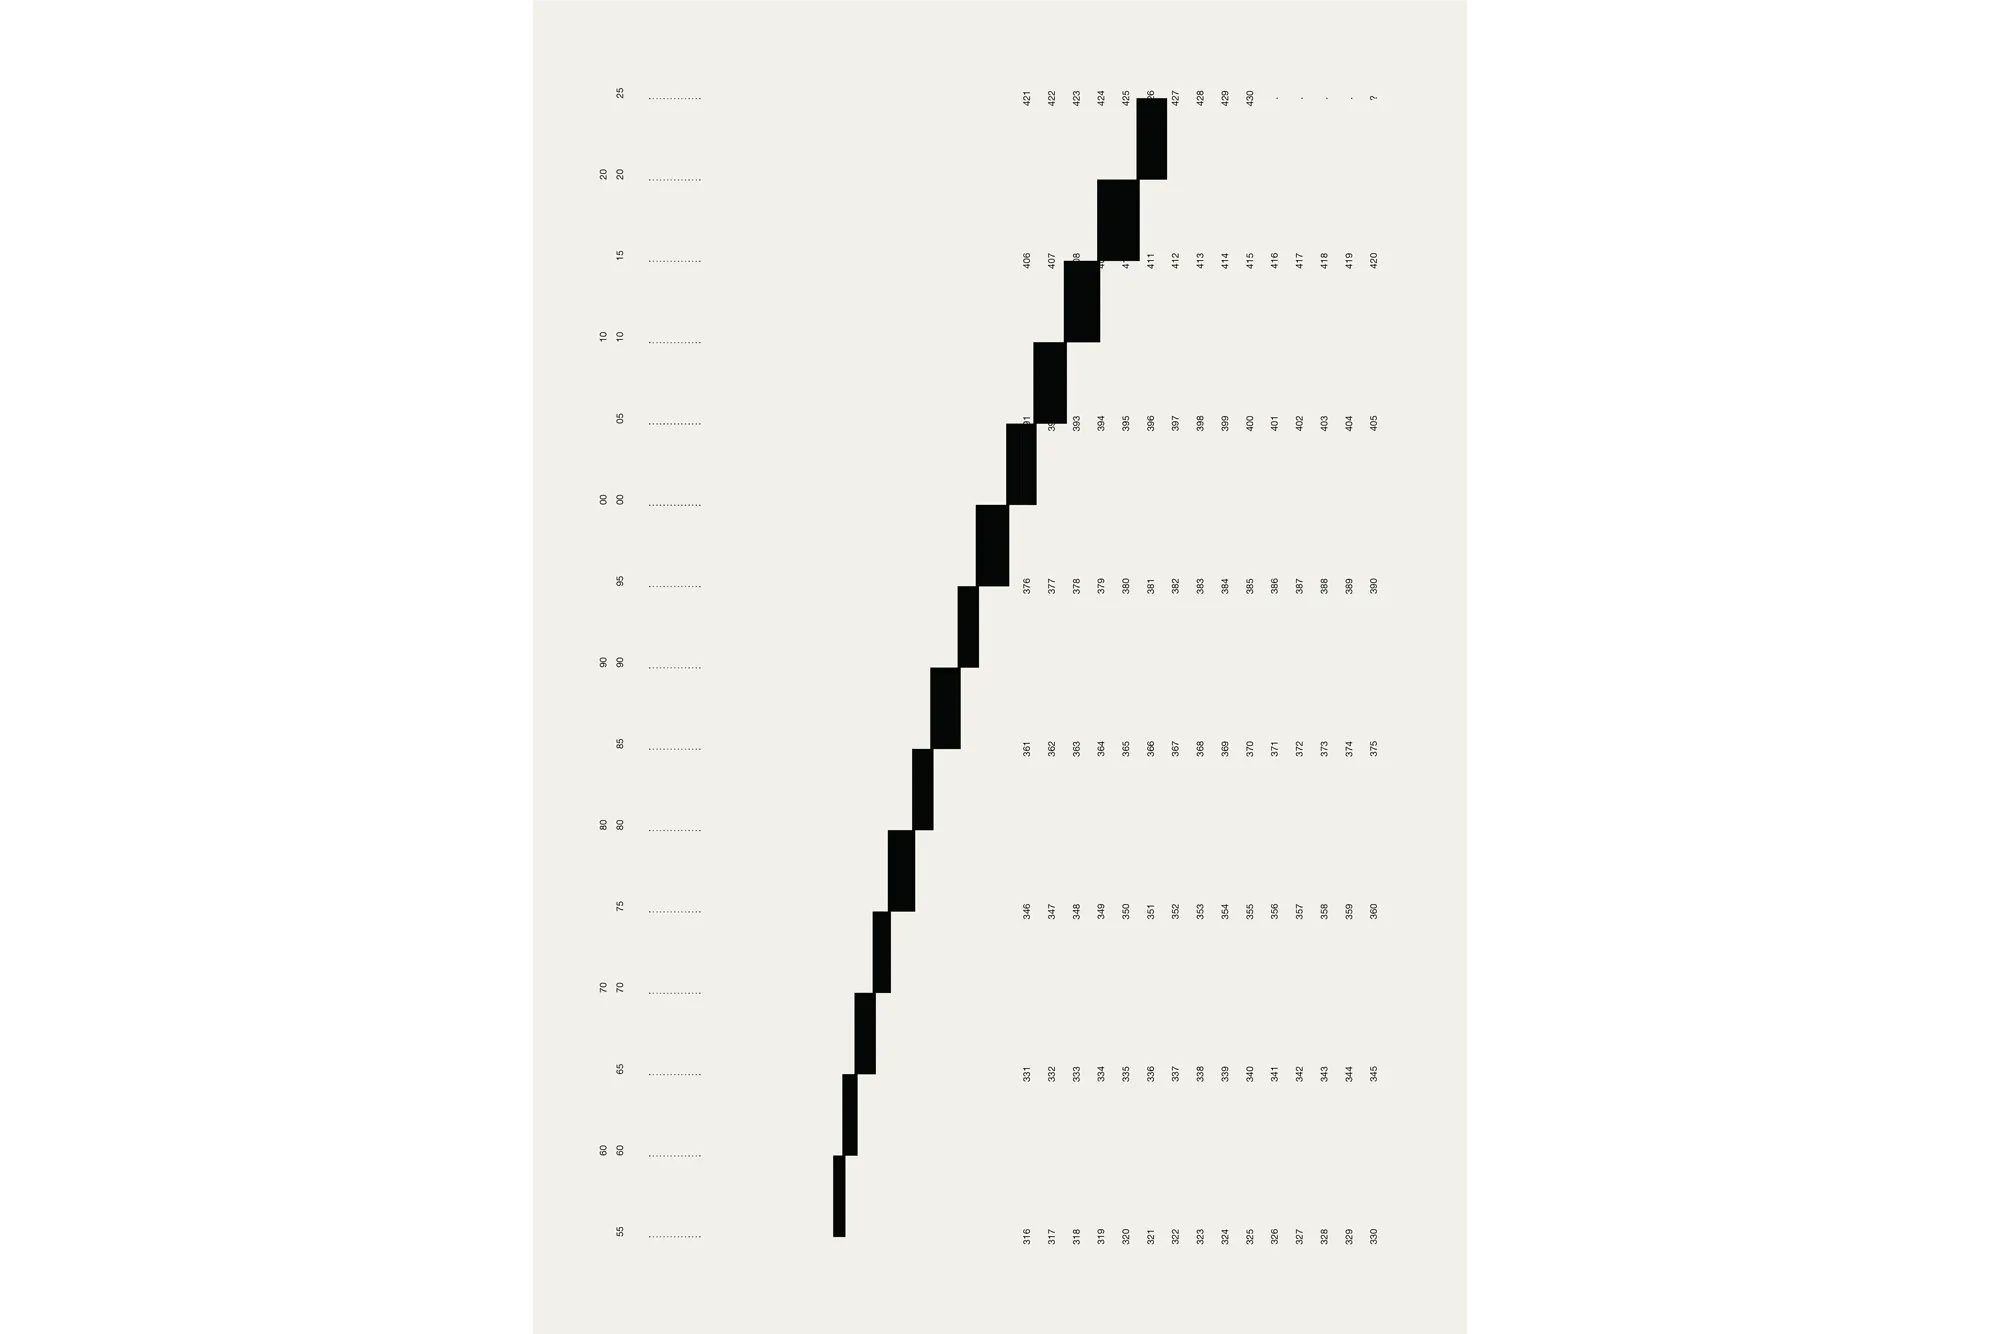
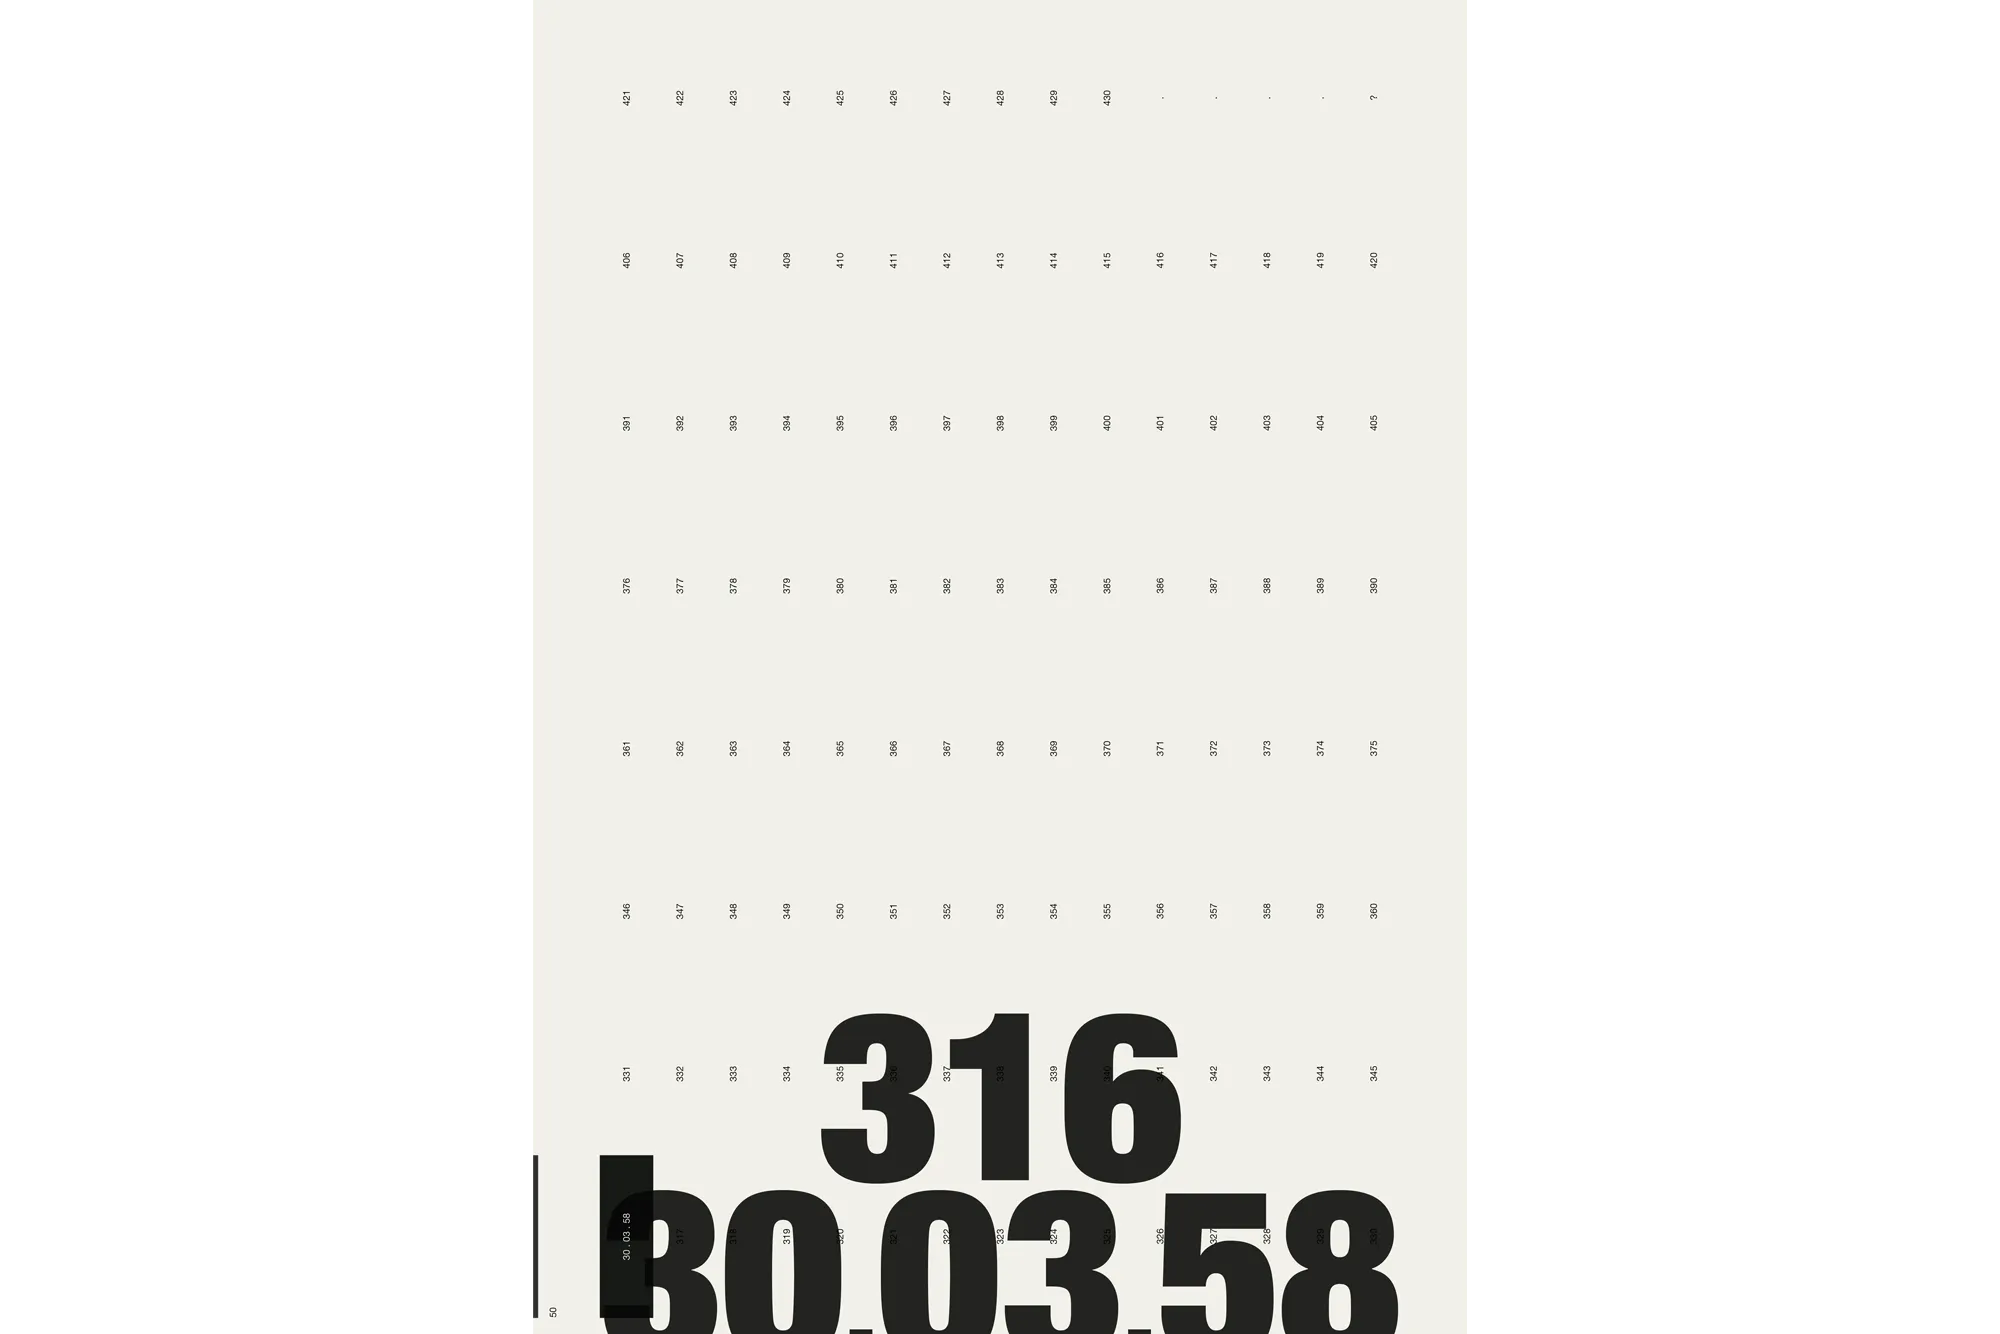
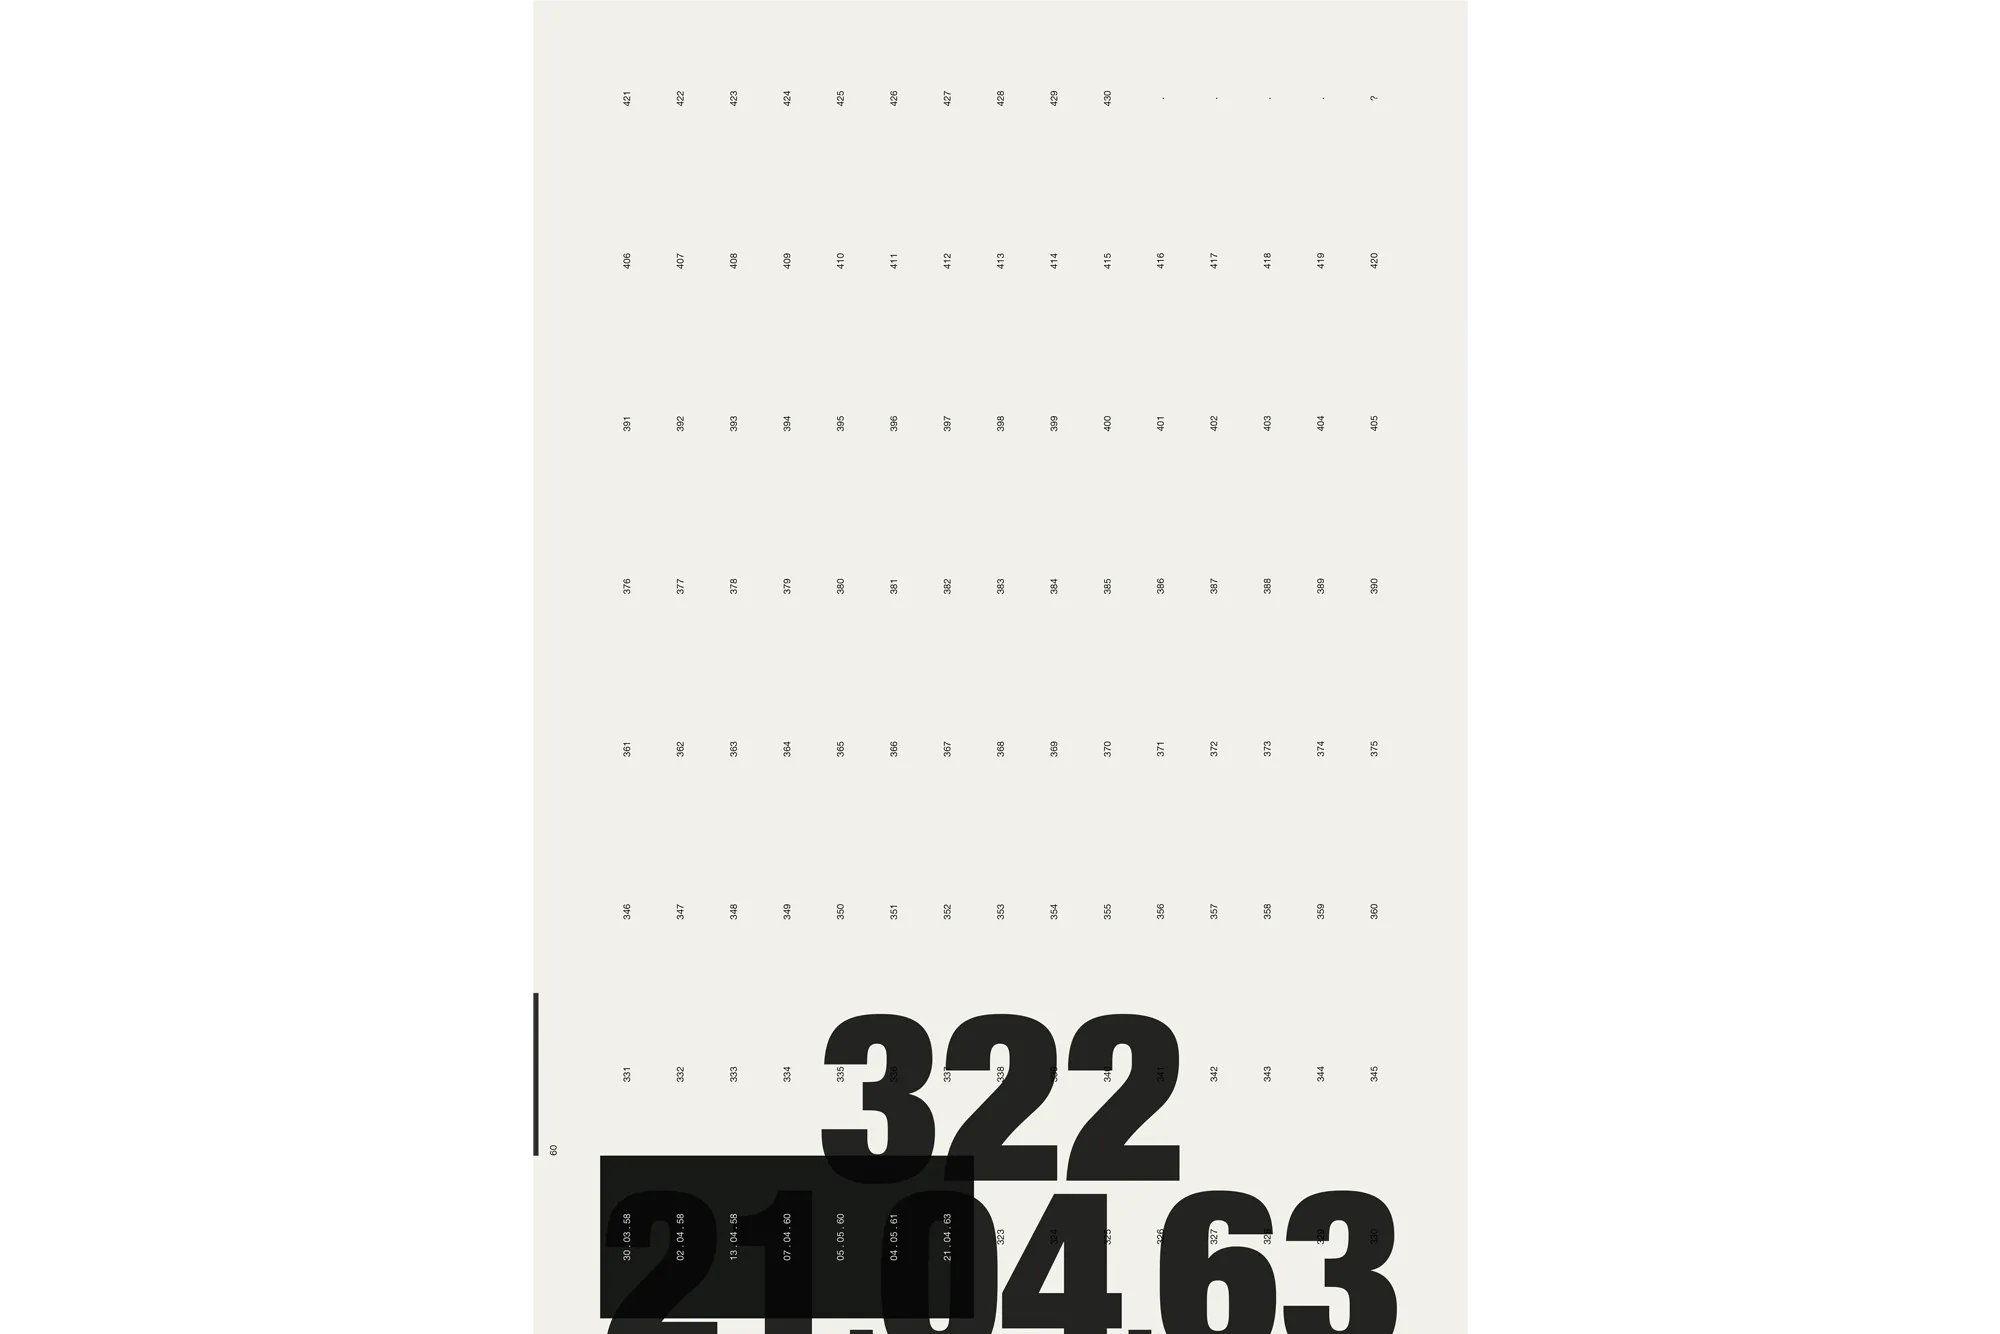
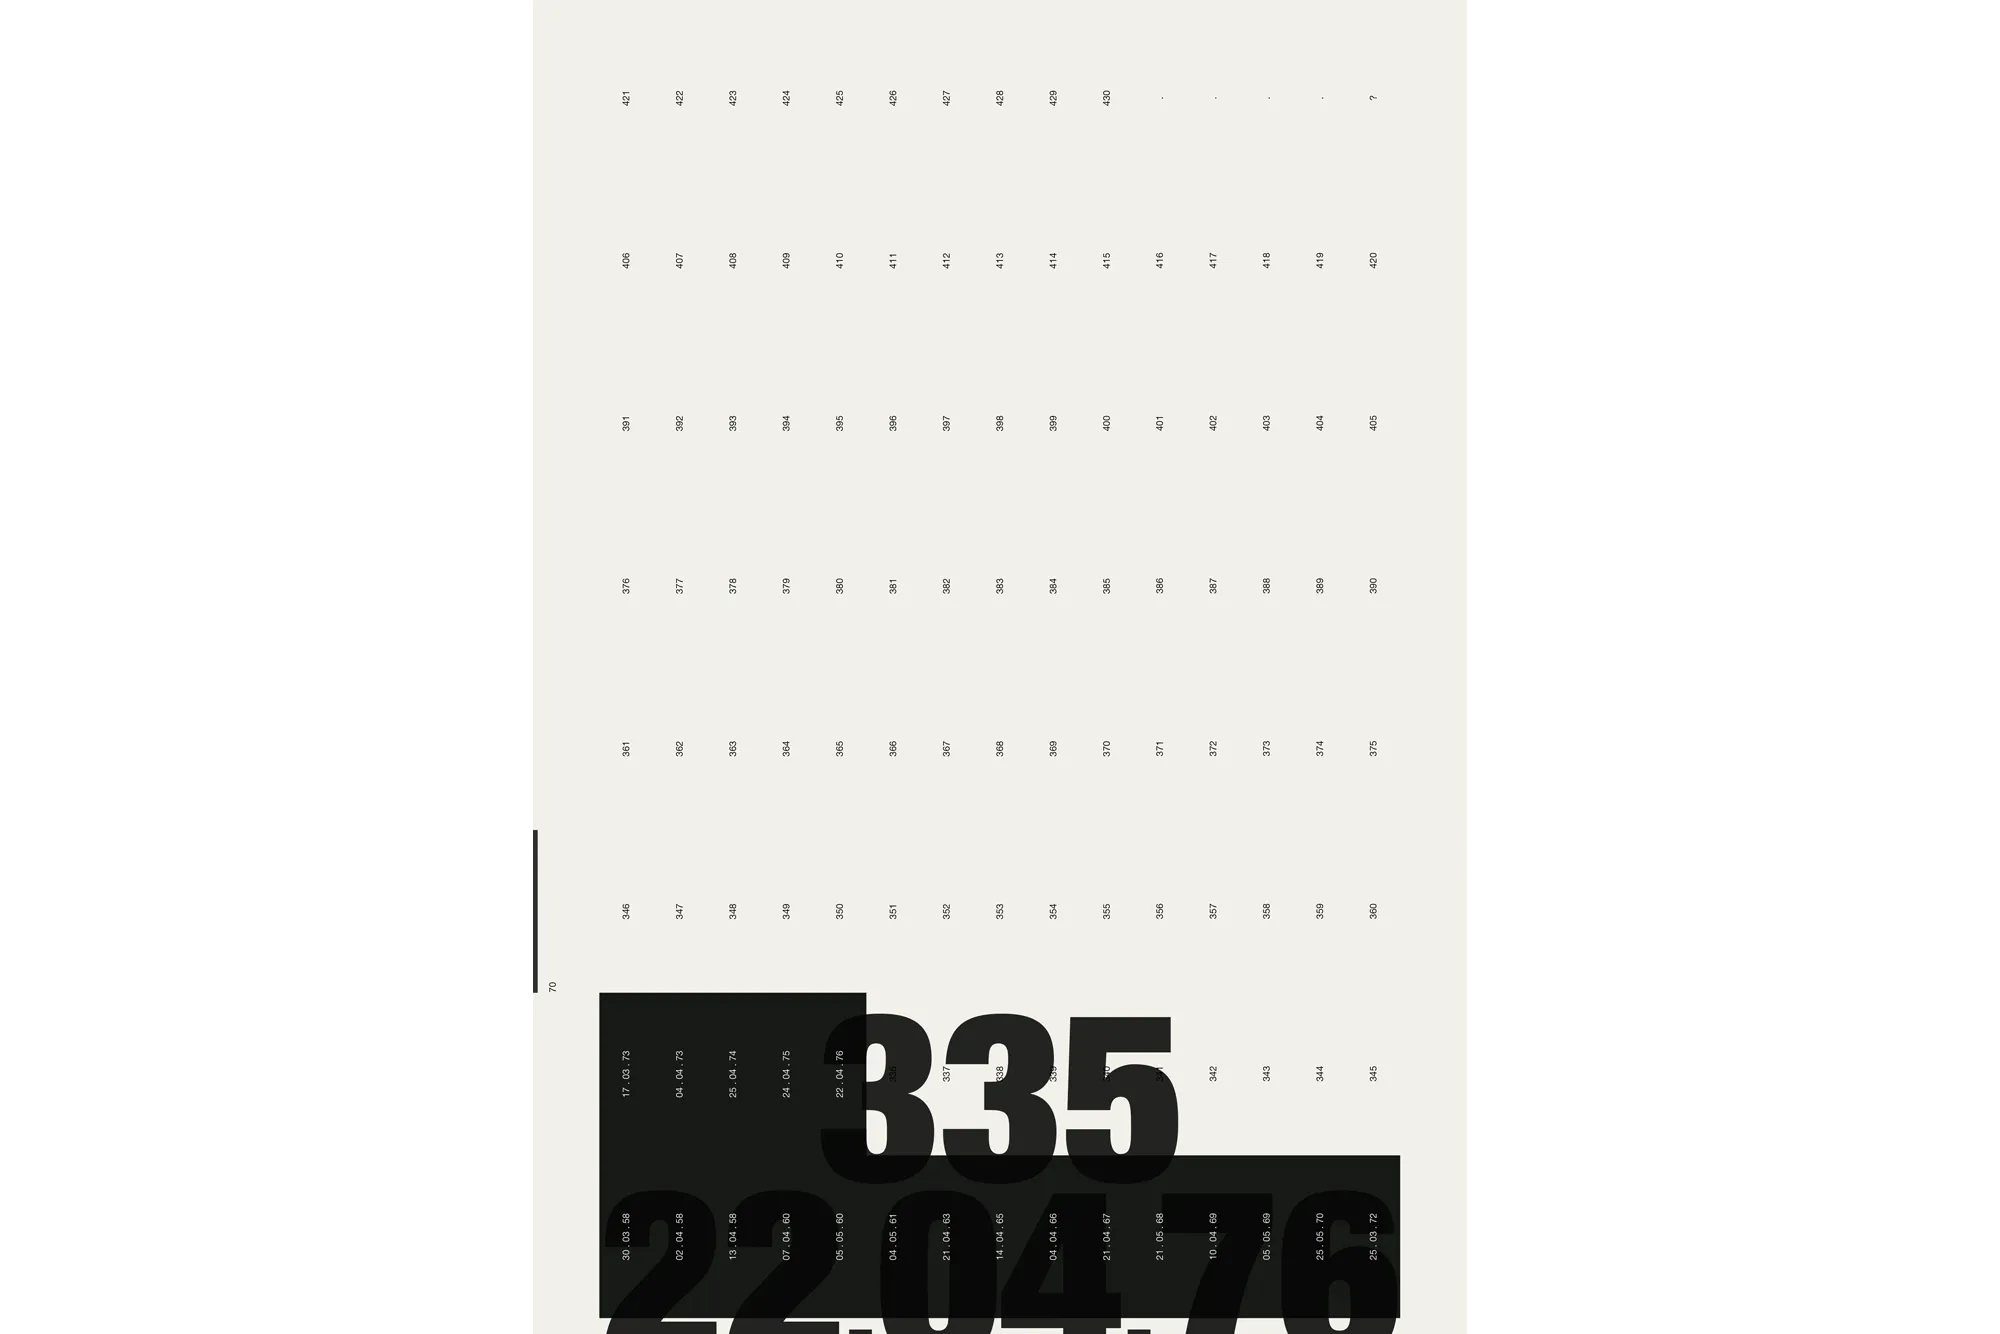
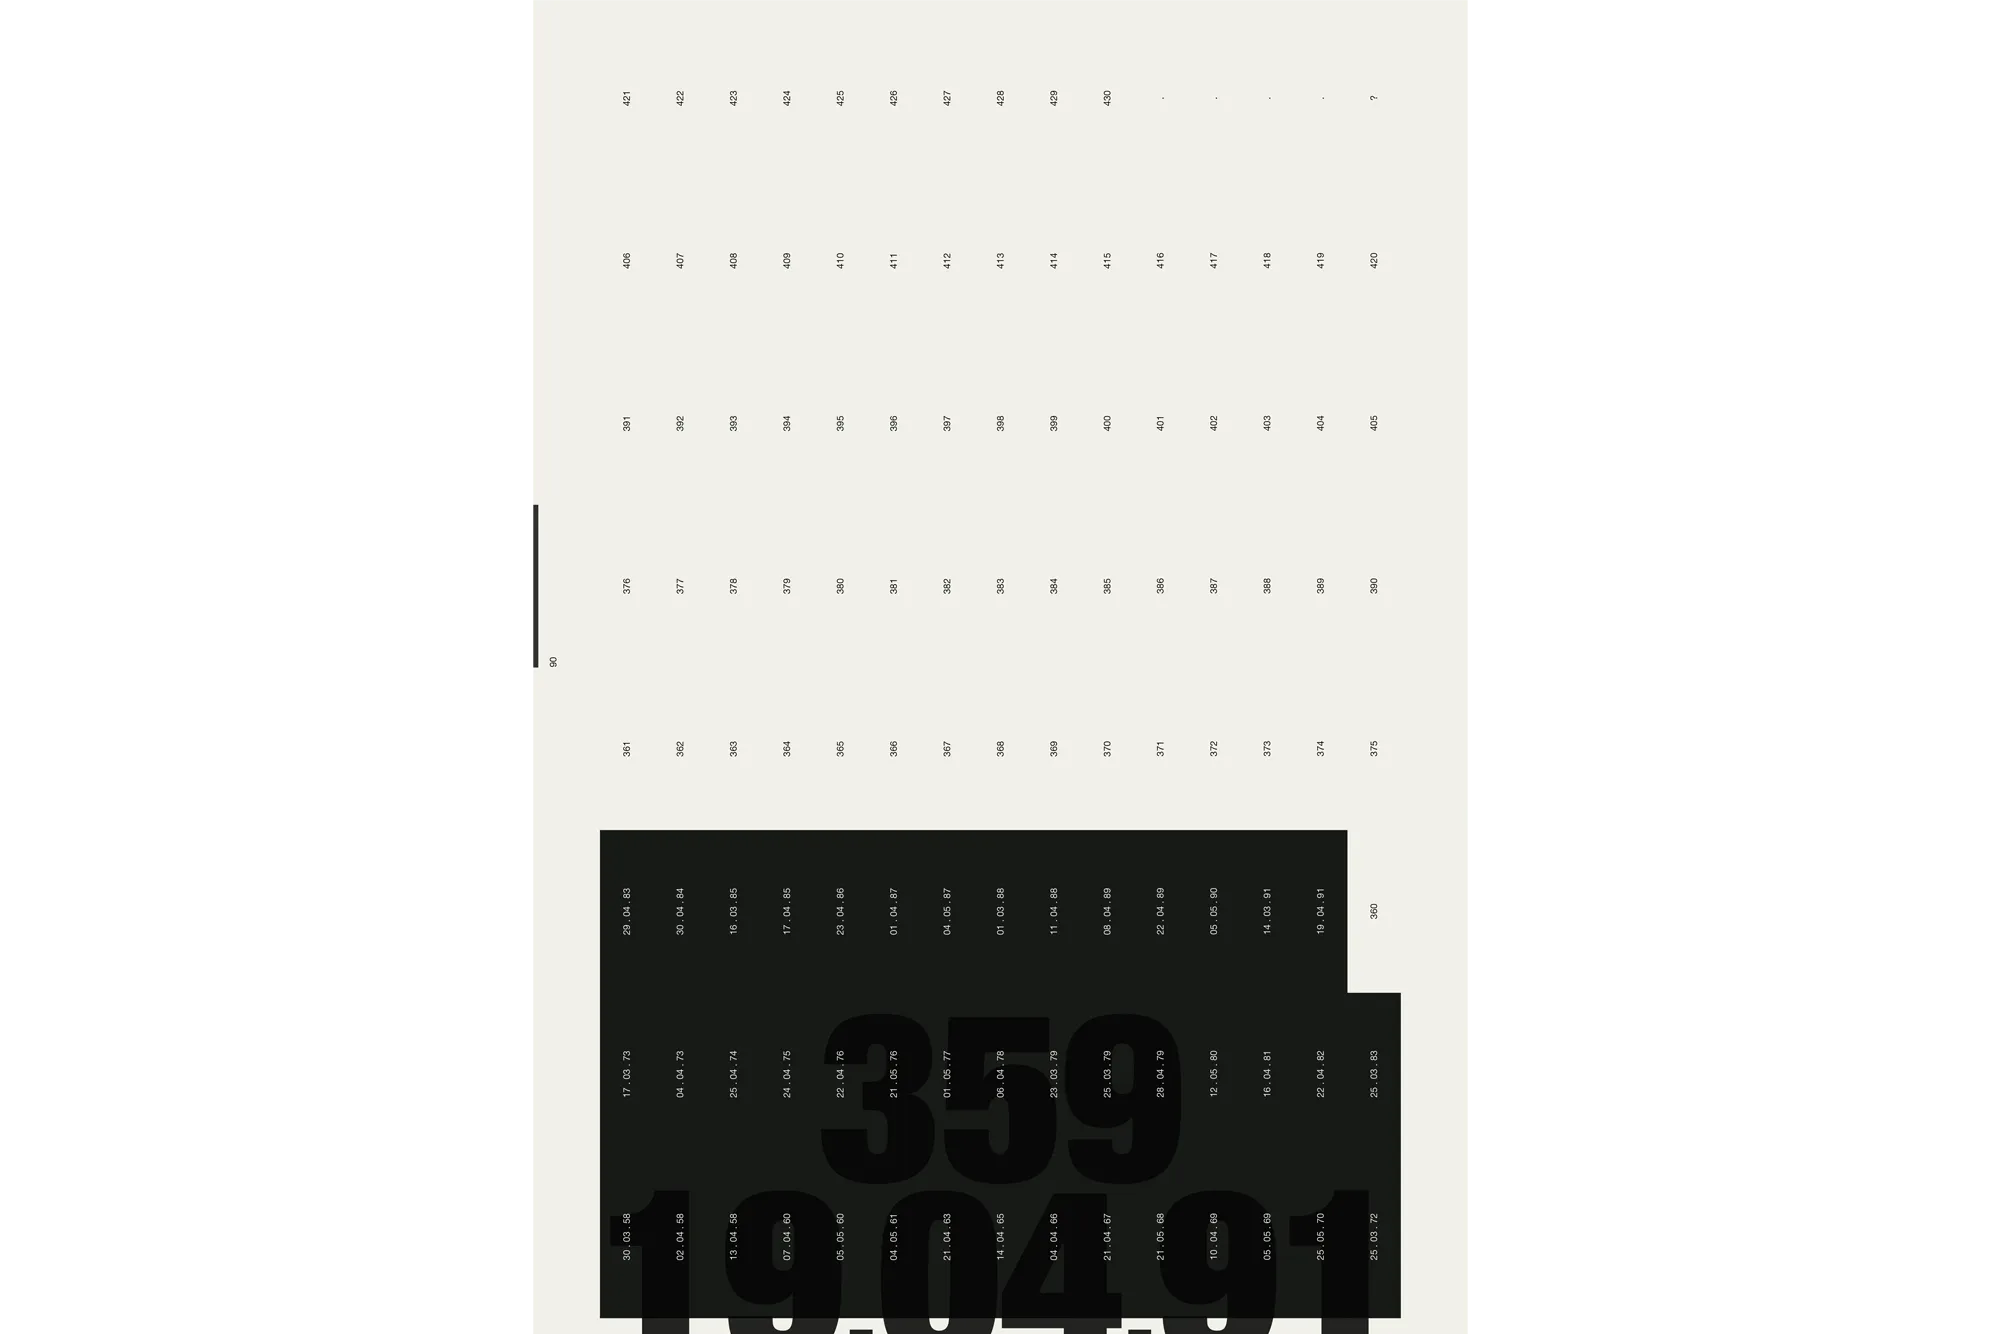
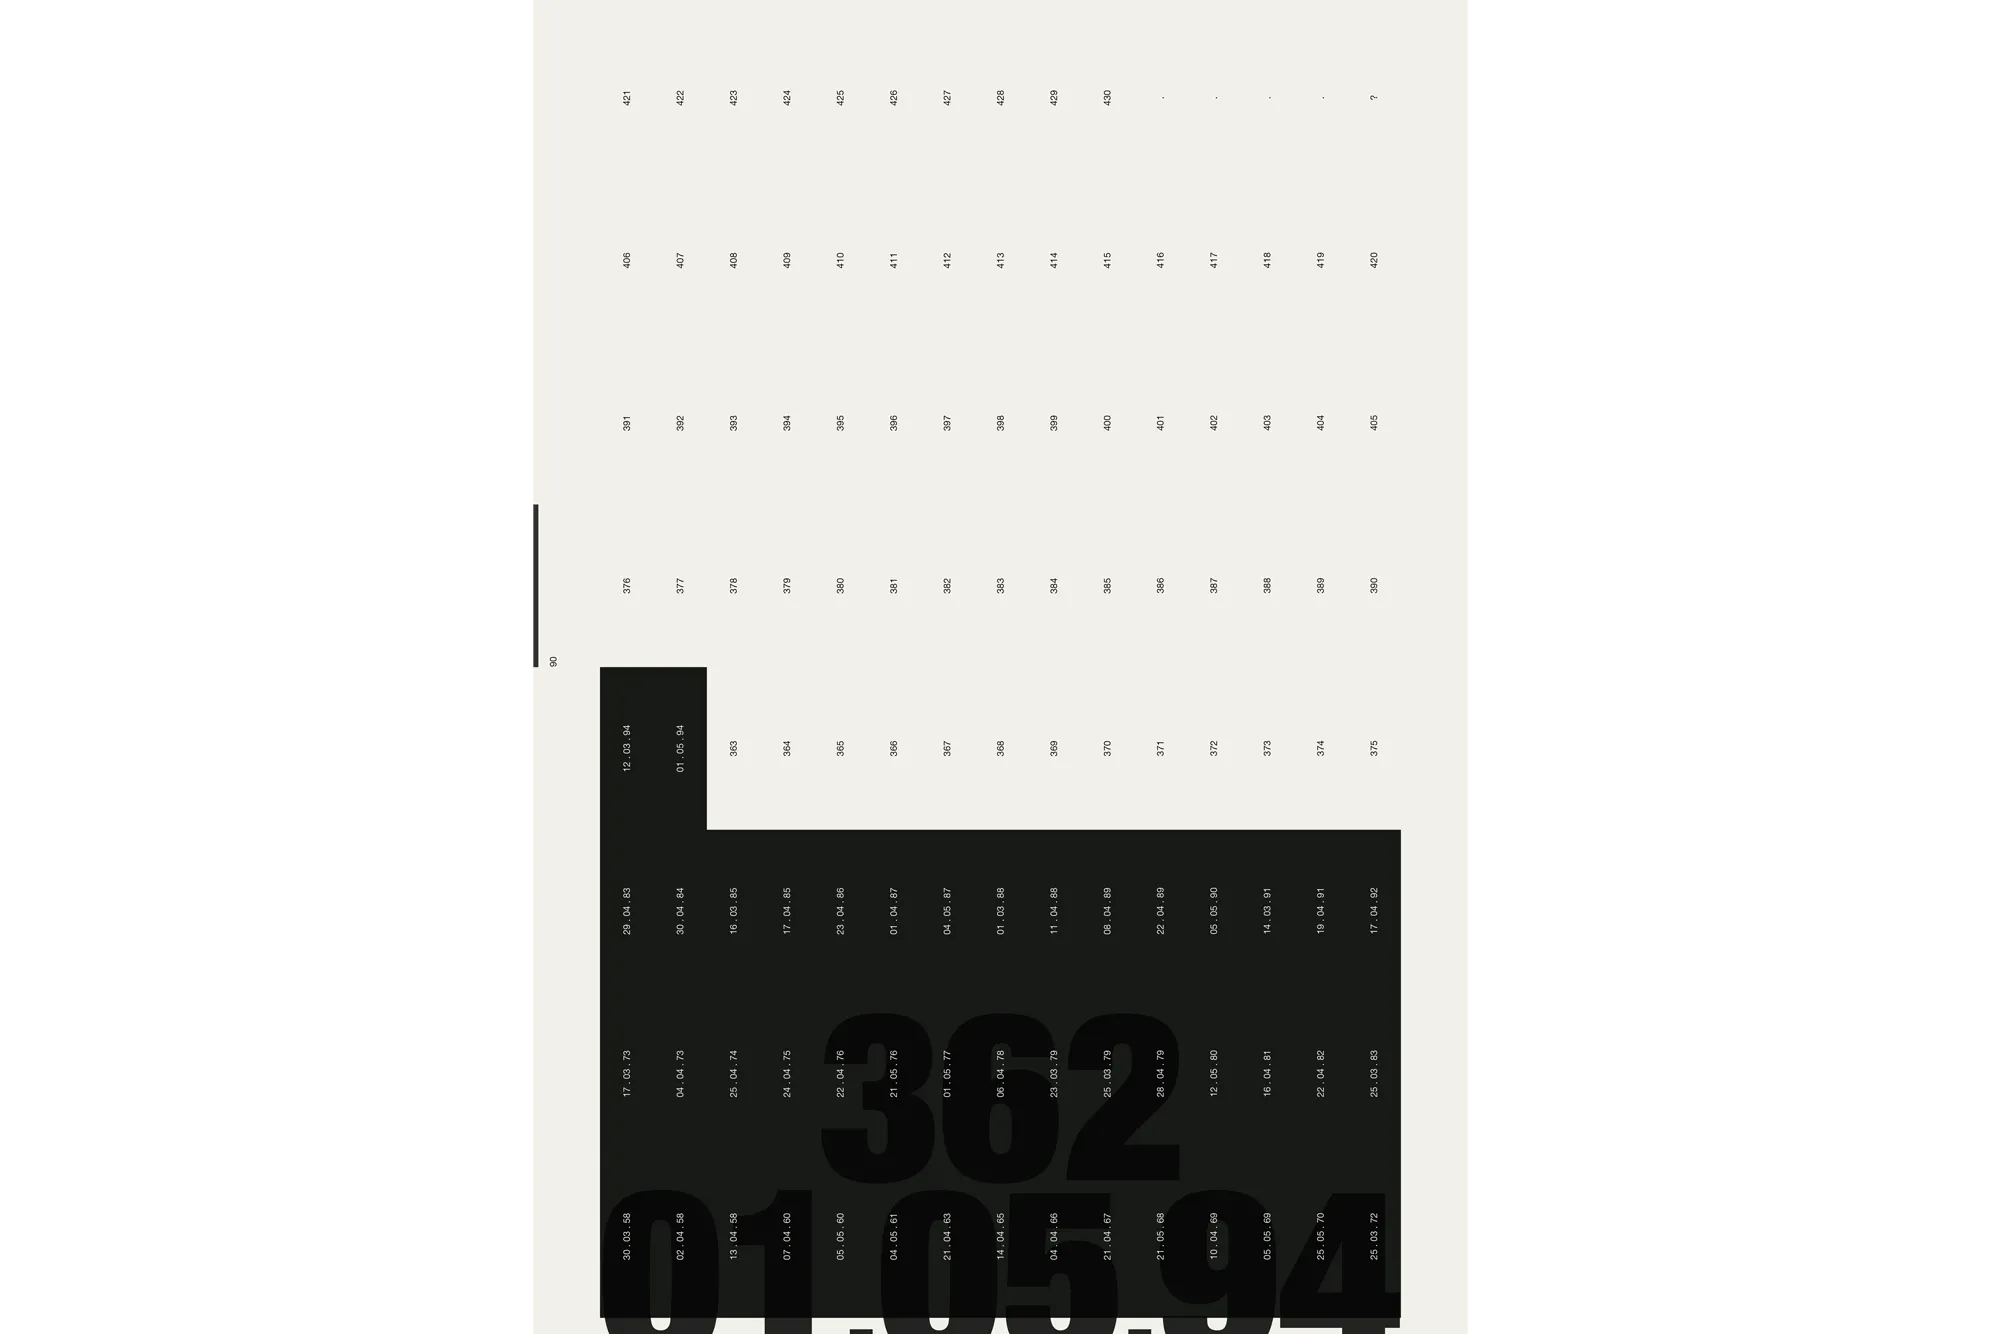
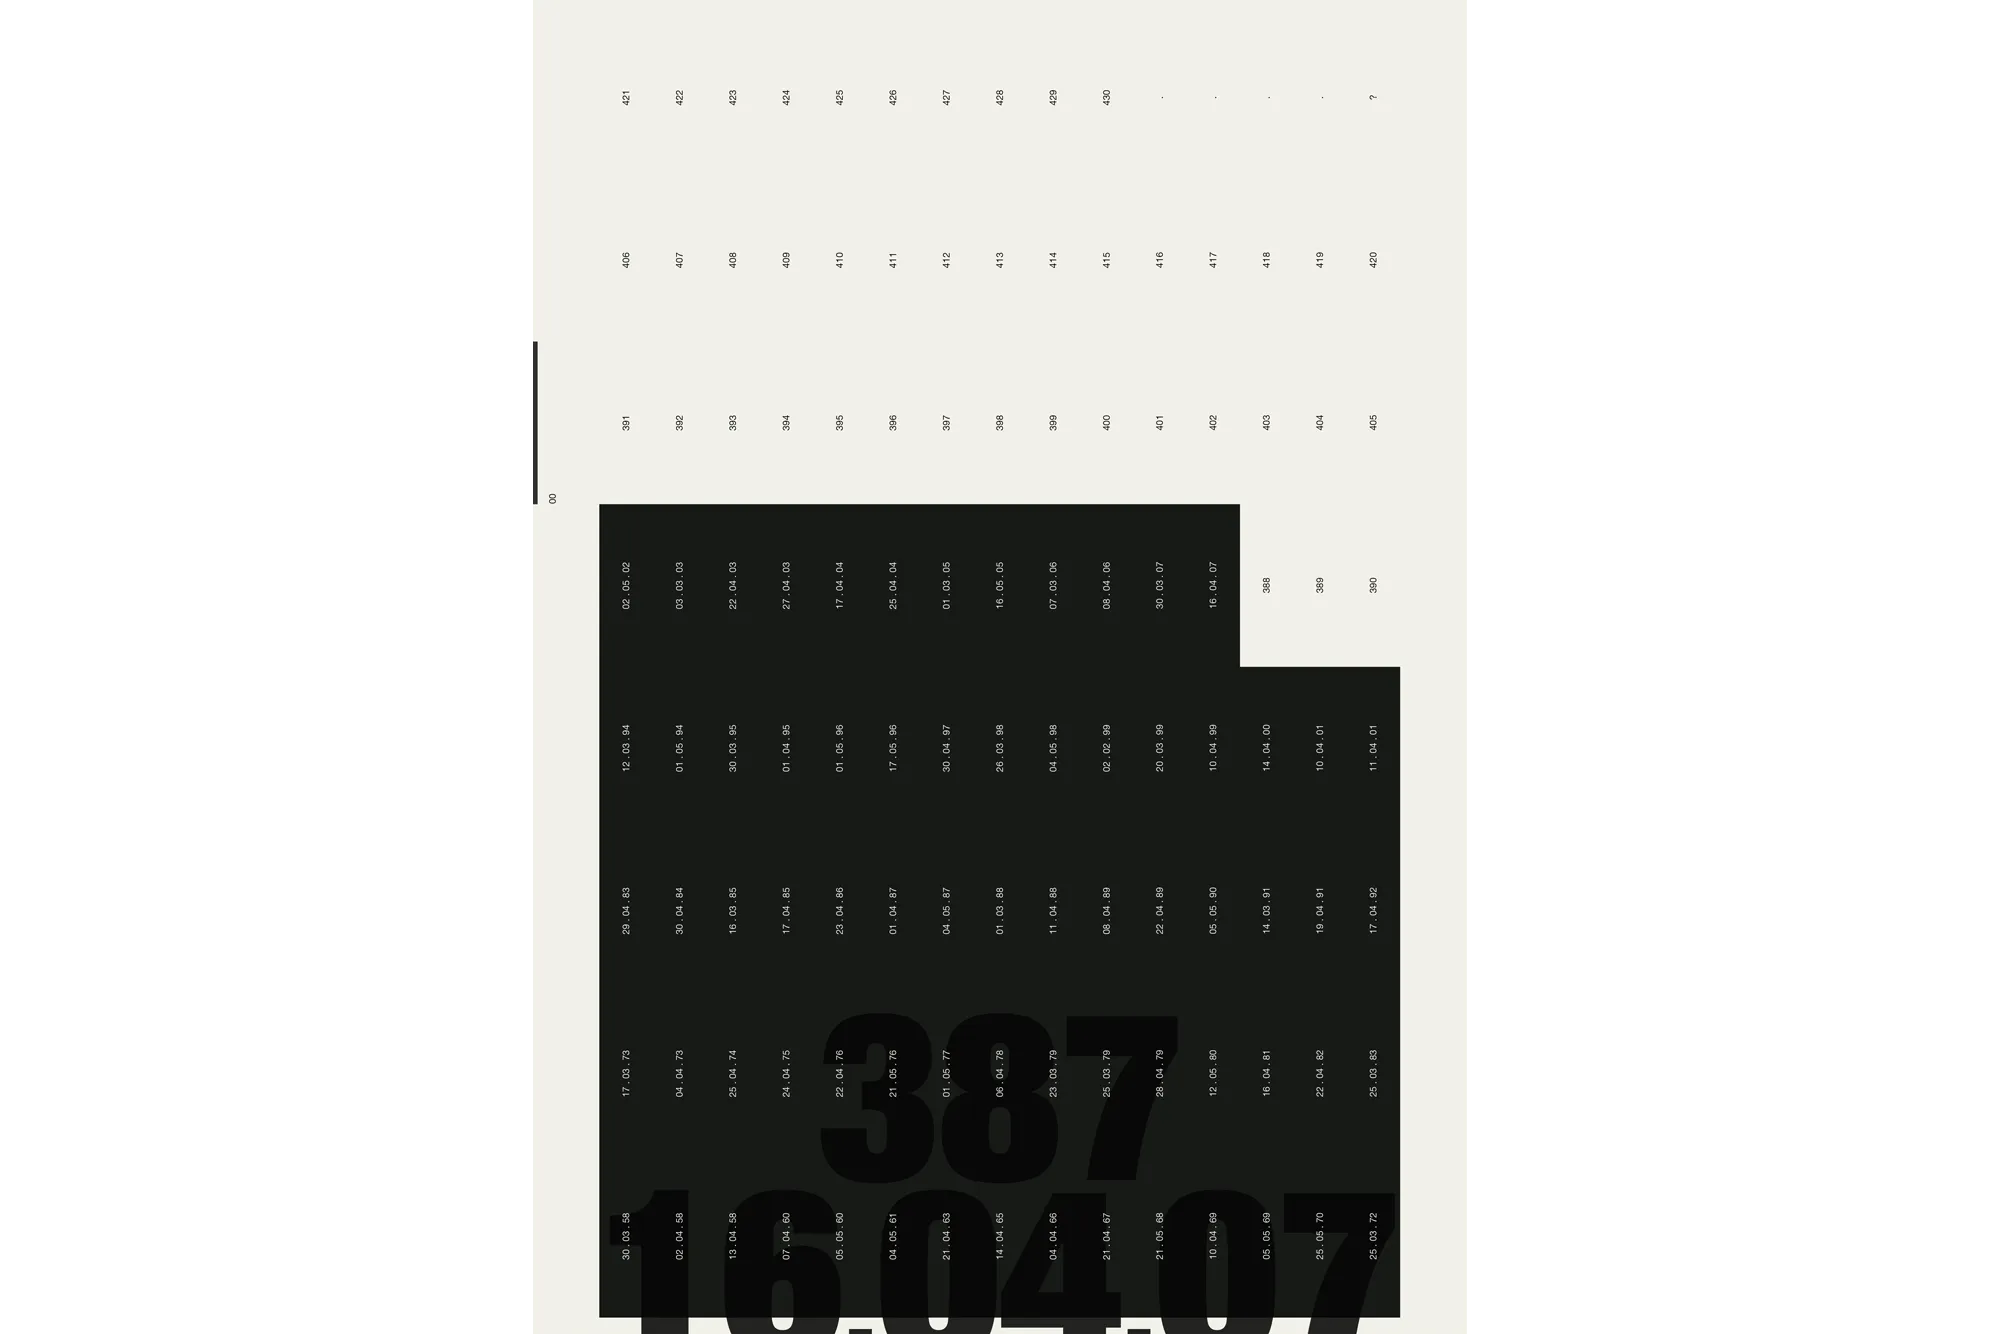
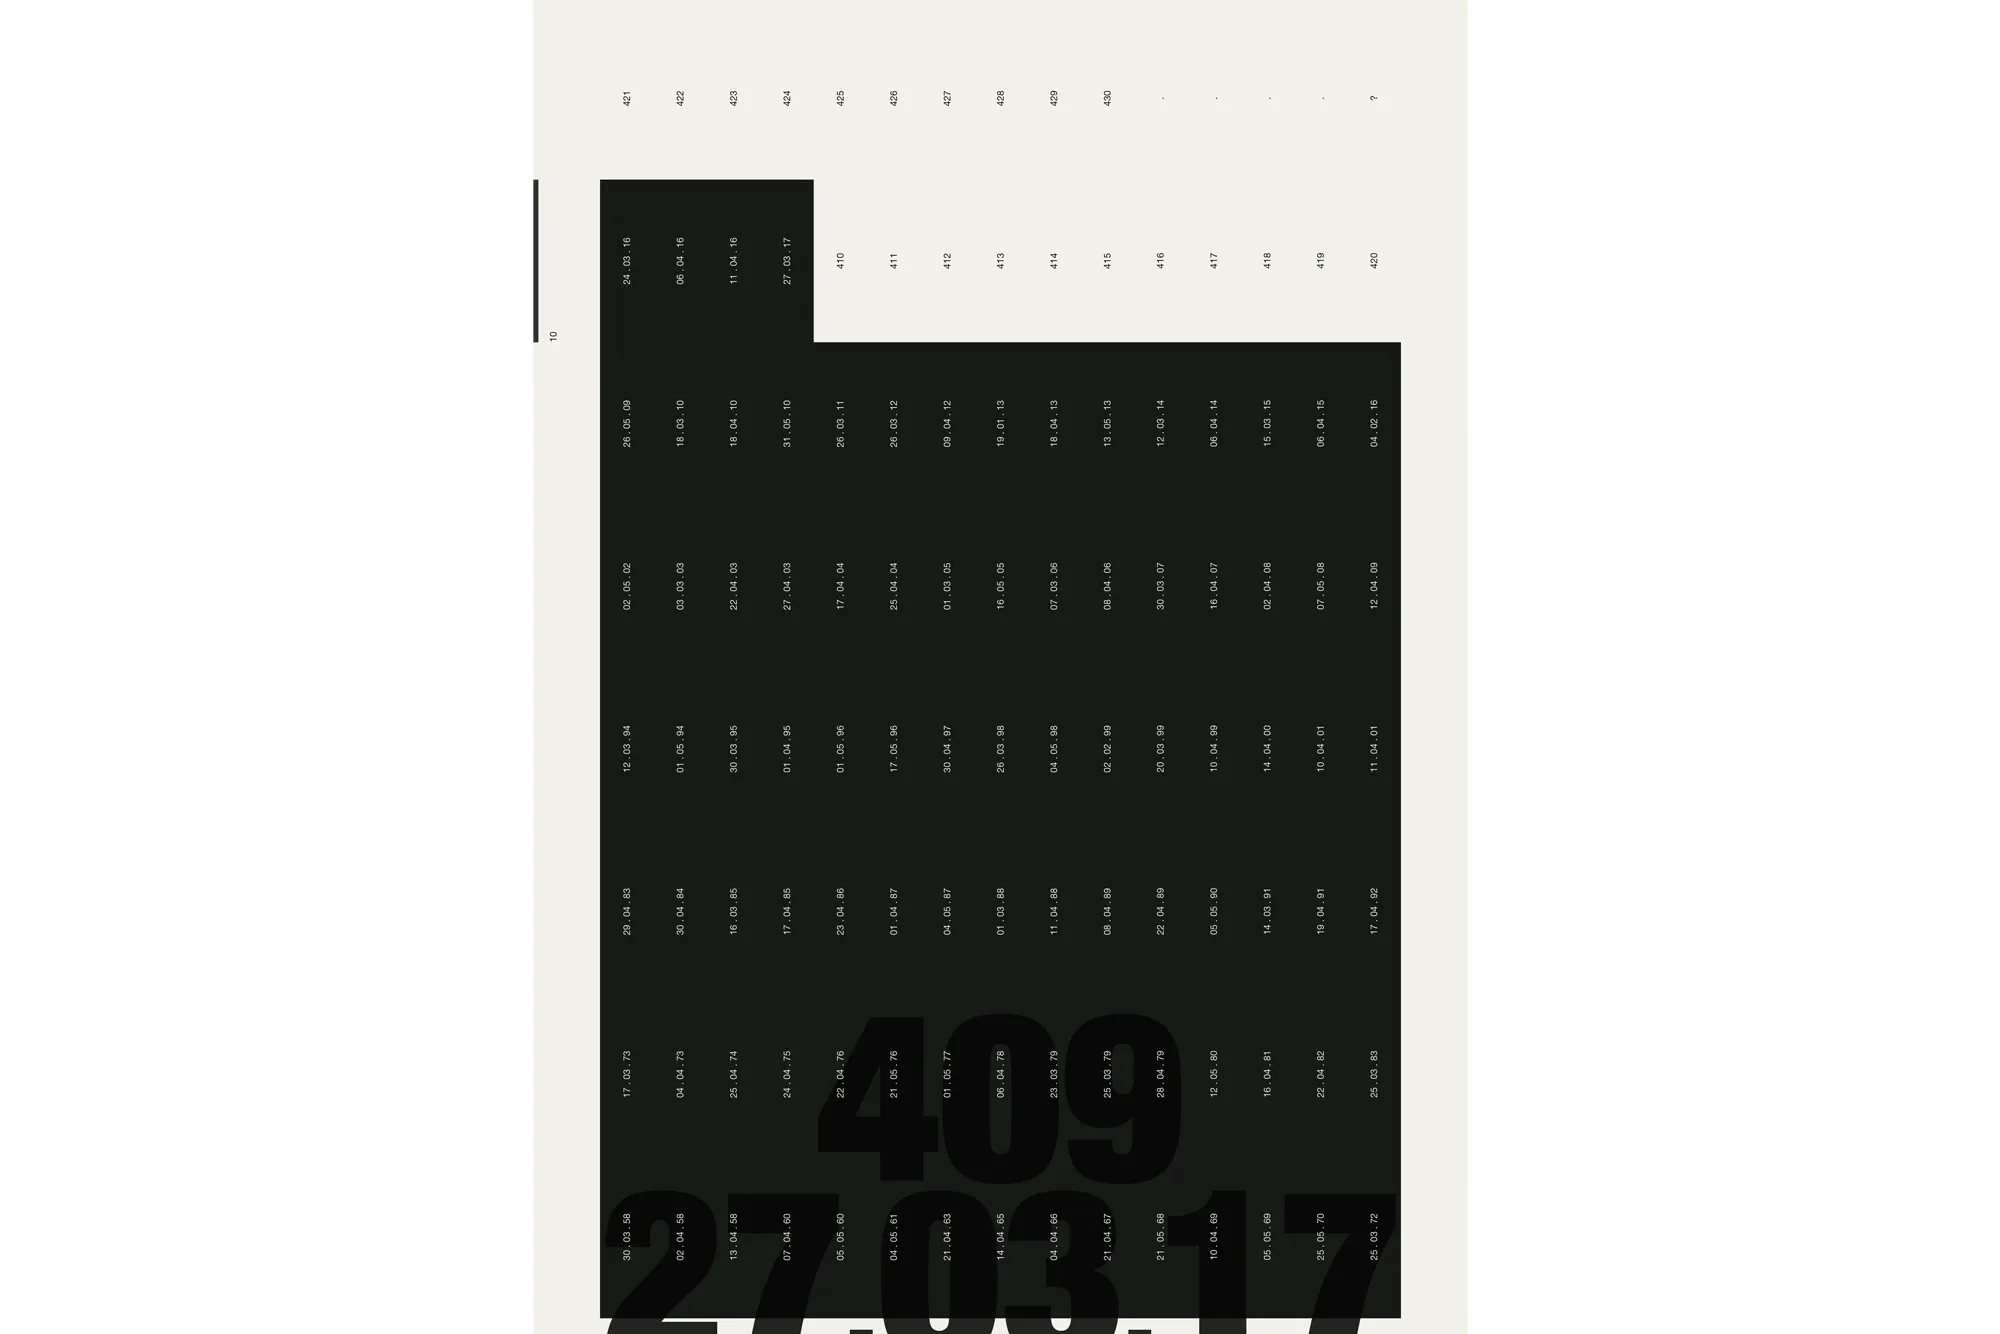
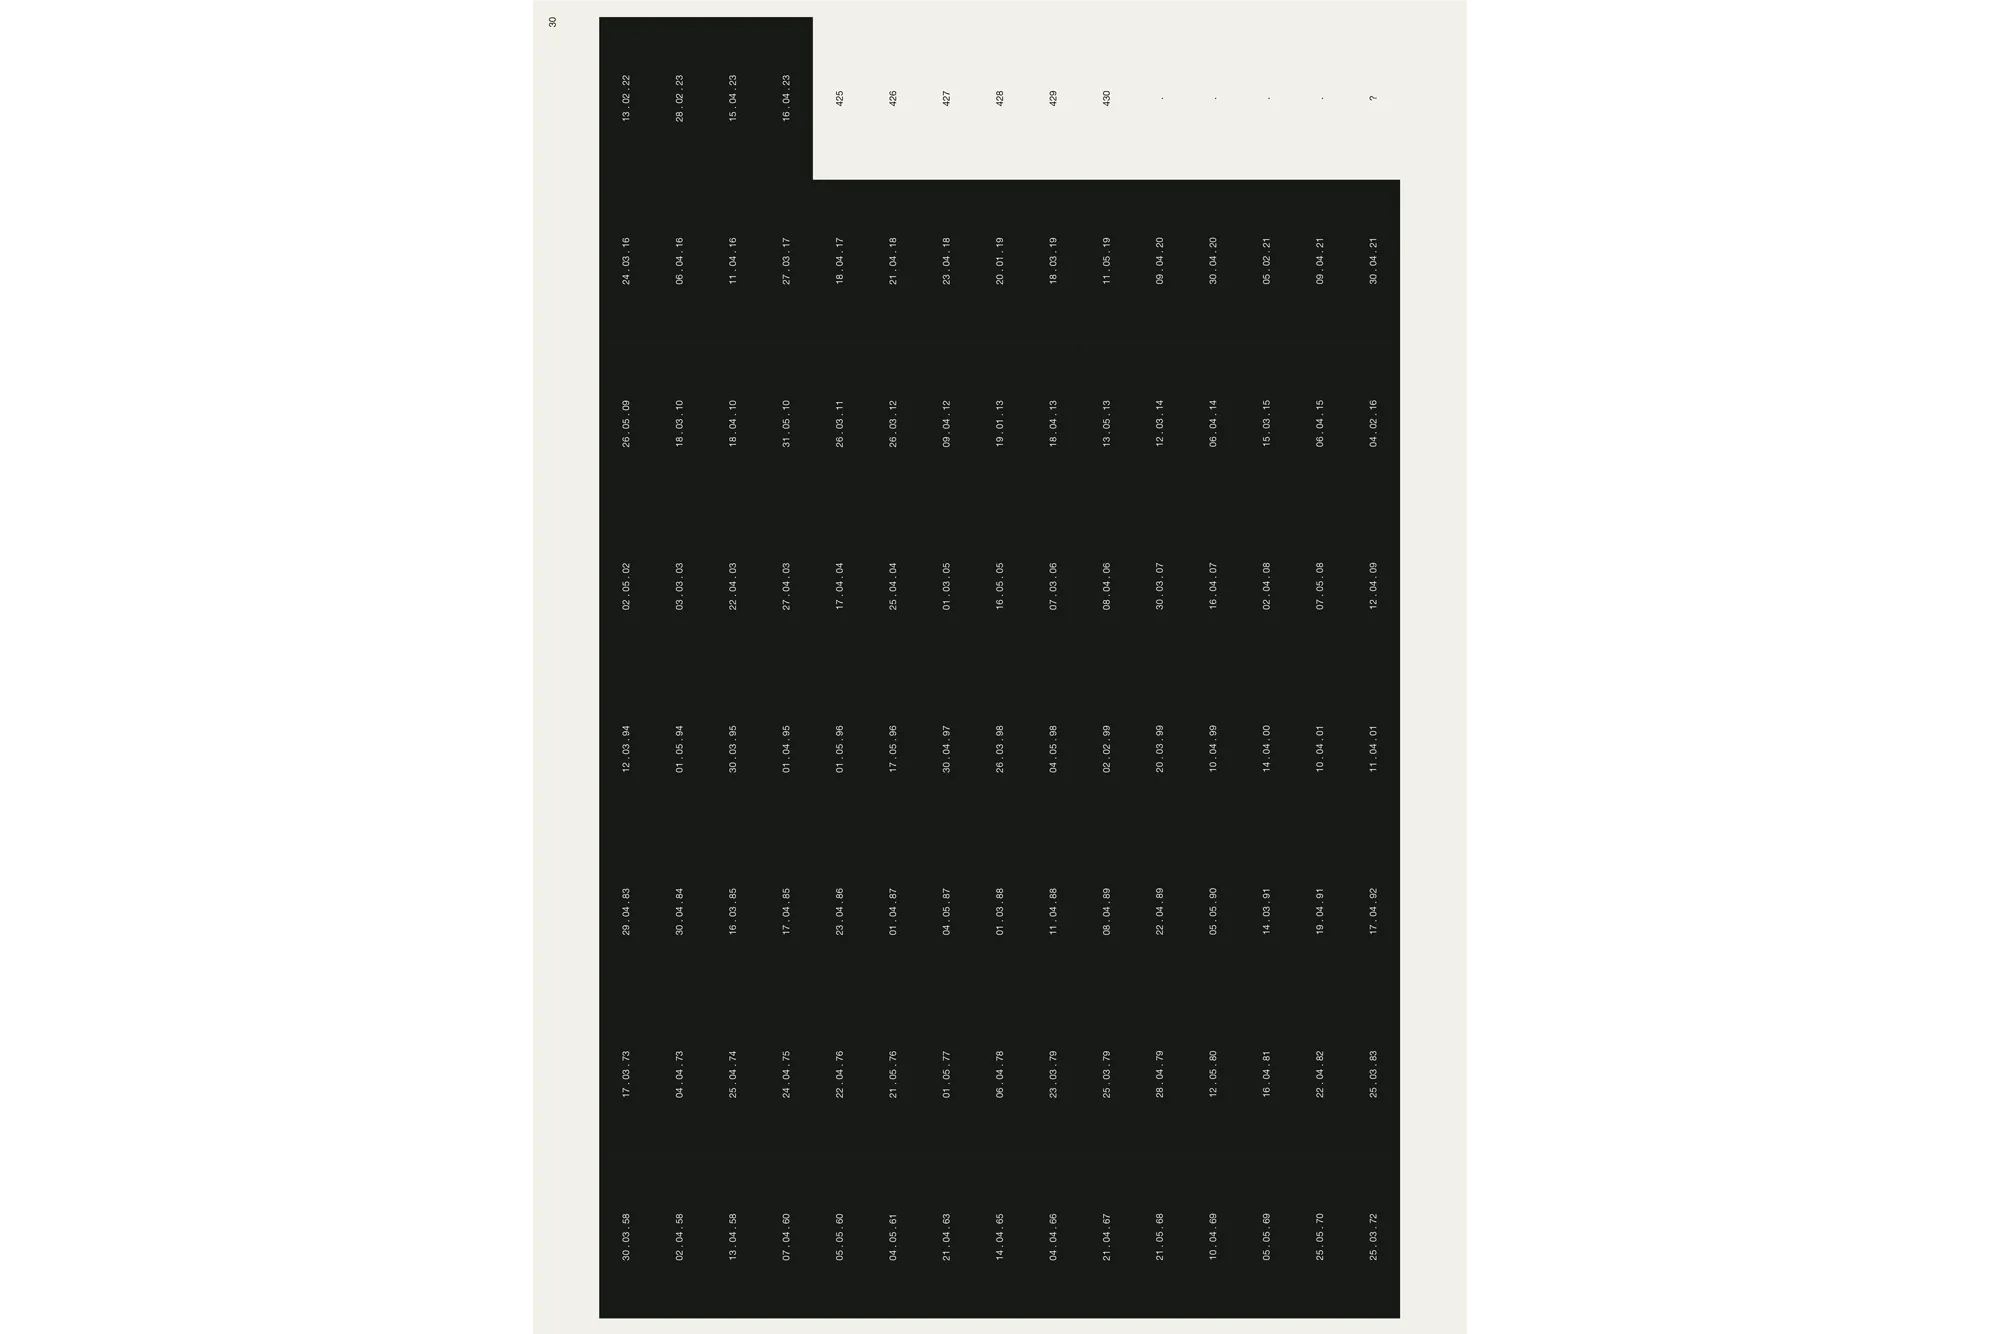
Each key date is presented across two pages — the New York Times front page paired with a data visualisation of the evolving situation. A grid page lists every parts per million value from 316 to 424, each number becoming a black rectangle marked with its date. By the time the reader reaches 424, the page is nearly solid black. The 430 threshold — the point of no return — marks the limit. The Keeling curve runs along the spine. A secondary visualisation emerges on the bottom edge, generated by a heading system combining parts per million values with their dates (e.g. 323, 14.04.65 _ 356, 22.04.89 _ 422, 28.02.23) — the consistent placement of day, month, and year producing a graphic rhythm visible on the closed book.
The book-object offers different perspectives to reading.

